
Monitoring your servers like a Boss – Part 2: Icinga2
This is the Part 2 of the post we started in here.
In this second part we will use Icinga2 to monitor this list of metrics and be preemptively notified when the values go over preset threshold. Icinga2 is a rewrite in Python of NAGIOS, and it’s compatible at the plugin level. In the off chance that the built-in plugins that come with Icinga2 are not suitable for your needs, you can head to Nagios Exchange or even write your own.
Icinga2 will send you email notifications when any of these resources run low. You can configure different threshold values for each metric to be monitored, but the defaults are a good starting point.
To recap part 1, some of the monitored metrics are:
- CPU Usage
- Disk usage
- Network usage
- Number of running processes
- SWAP usage
- Others
As always, the tools we will be discussing are Open Source and run on GNU/Linux. For this tutorial, we will use Ubuntu 16.04, but the steps should be similar in other Debian-based distros. RedHat-based and others may have different package names so beware!
We will also be using domain names that end in .yourdomain.com
You will need to change this to the actual domain names that resolve to your server’s IP addresses.
Finally after the intro, onwards to Icinga2!
Icinga2
Now we move on to installing and configuring Icinga2 to ensure email notifications get sent every time one of the resources in our servers run low.
Master Node
This node is the one that will collect all metrics from the client servers, handle notifications and run the Web UI. In a basic setup you only need one Master node.
As your infrastructure grows, you may need to have intermediate servers to collect metrics, distribute configurations and send commands. These intermediate nodes are called satellites. For more information on more complex setup, see Distributed Monitoring.
The first step is to add Icinga2’s repository to your server. You want to use Icinga’s repos because they carry newer versions of the software:
wget -O - https://packages.icinga.com/icinga.key | apt-key add -
echo "deb http://packages.icinga.com/ubuntu icinga-xenial main" >> /etc/apt/sources.list.d/icinga2.list
echo "deb-src http://packages.icinga.com/ubuntu icinga-xenial main" >> /etc/apt/sources.list.d/icinga2.list
apt update
Then we install Icinga2, MySQL (if its not installed on your server yet), the monitoring-plugins and the icinga2-ido-mysql package:
apt install icinga2 mysql-server mysql-client icinga2-ido-mysql monitoring-plugins
If this is the first time you are installing MySQL you’ll need to choose a root password. Make sure you choose a secure password!
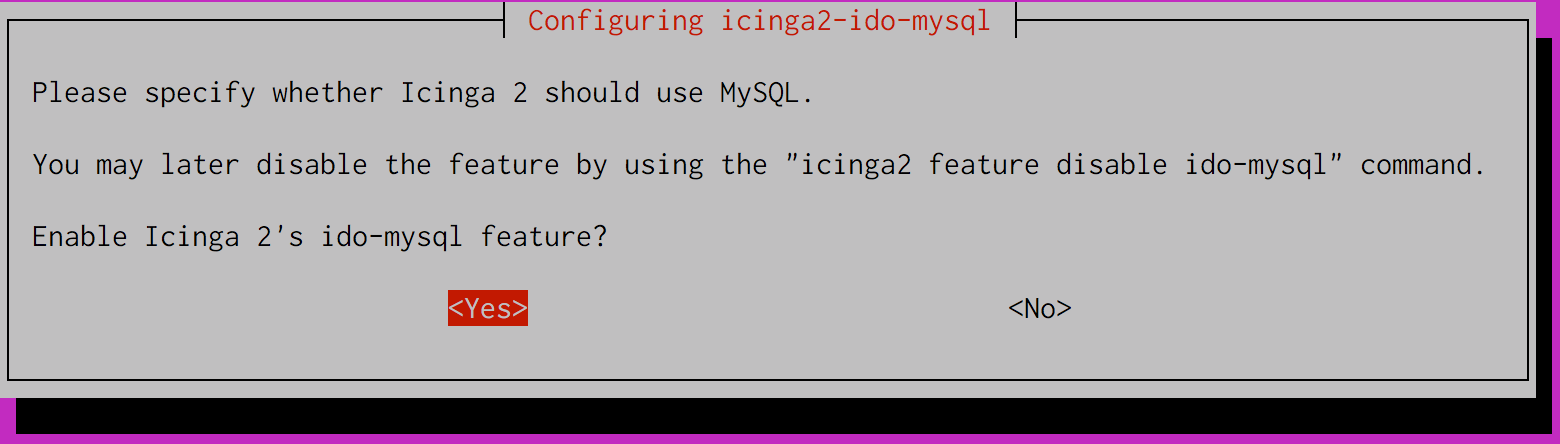
When icinga2-ido-mysql package is installing, it will ask if you want to enable the ido-mysql feature. Respond “yes”.
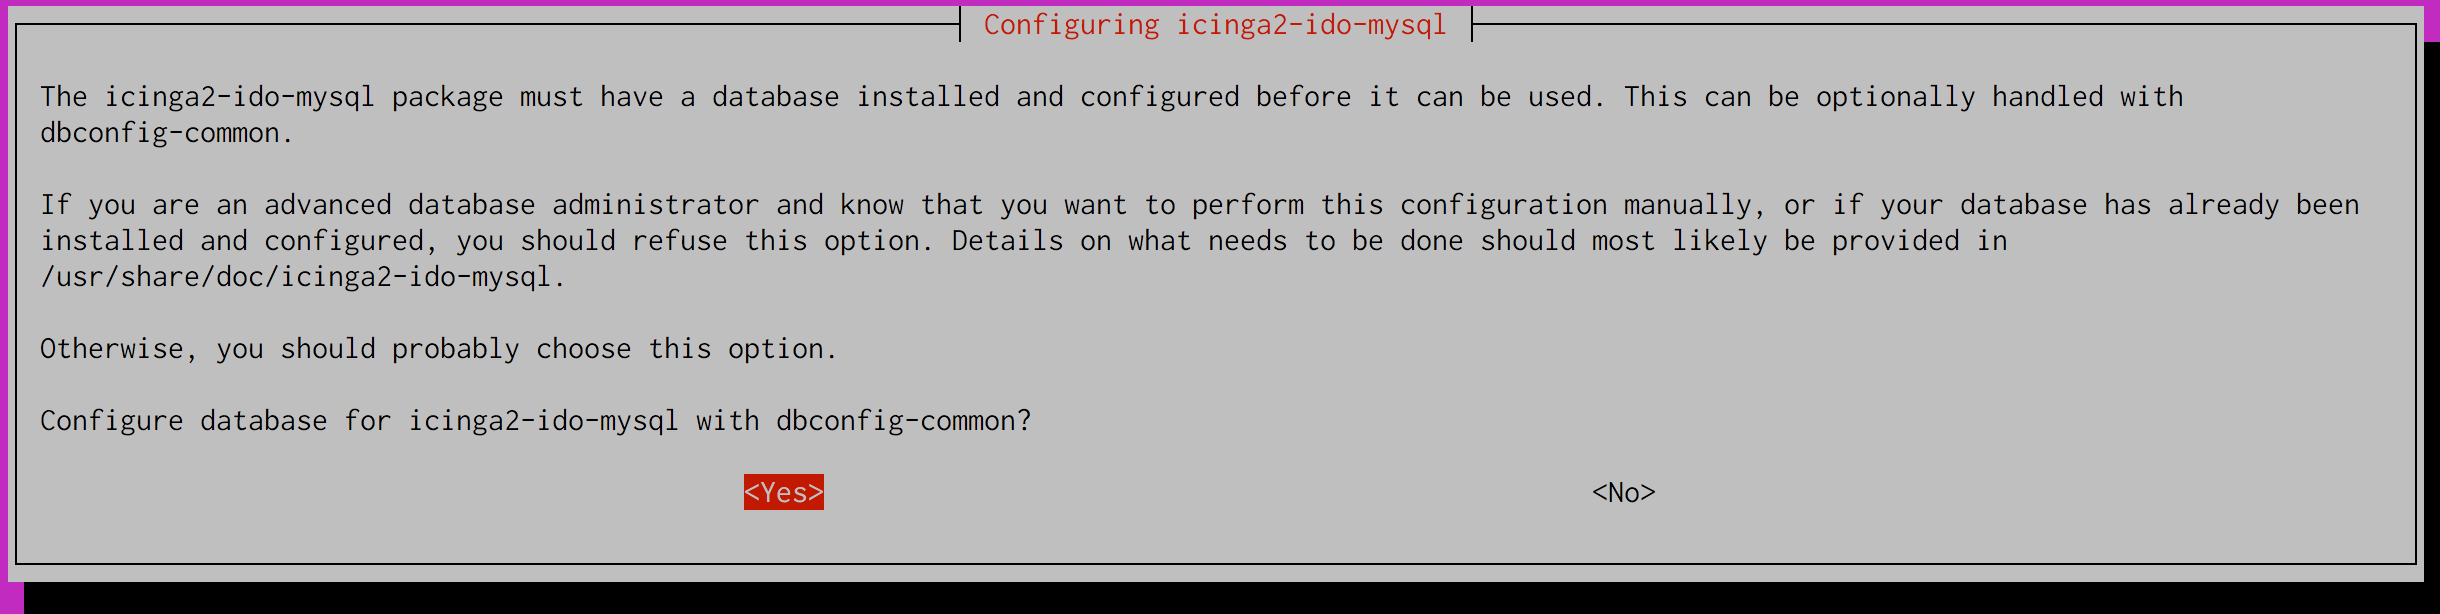
Next you will be asked if you want to configure the database for icinga2-ido-mysql with dbconfig-common, respond “yes”.
You will now be asked to setup a password for the Icinga2 database, again make sure to use a secure password please.
To finalize the basic Icinga2 installation, you need to enable the icinga2-ido-mysql module and the command module and restart Icinga2:
icinga2 feature enable ido-mysql
icinga2 feature enable command
service icinga2 restart
The last step is to setup the Server to be a Master Node. To start this step run:
icinga2 node wizard
I put my inputs below in bold so you can see what you need to input:
icinga2 node wizard

Welcome to the Icinga 2 Setup Wizard!

We'll guide you through all required configuration details.

Please specify if this is a satellite setup ('n' installs a master setup) [Y/n]:
n
Starting the Master setup routine...

Please specify the common name (CN) [monitor.yourdomain.com]:
Reconfiguring Icinga...
Checking for existing certificates for common name 'monitor.yourdomain.com'...
Certificates not yet generated. Running 'api setup' now.
Generating master configuration for Icinga 2.
Enabling feature api. Make sure to restart Icinga 2 for these changes to take effect.

Master zone name [master]:
<enter>
Default global zones: global-templates director-global
Do you want to specify additional global zones? [y/N]:
<enter>
Please specify the API bind host/port (optional):
Bind Host []:
<enter>
Bind Port []:
<enter>
Do you want to disable the inclusion of the conf.d directory [Y/n]:
<enter>
Disabling the inclusion of the conf.d directory...
Checking if the api-users.conf file exists...

Done.

Now restart your Icinga 2 daemon to finish the installation!
Now enable the global-templates in /etc/icinga2/zones.conf, so we can have all the templates used in our infrastructure in one central location:
cat <<EOF >>/etc/icinga2/zones.conf
object Zone "global-templates" {
  global = true
}
EOF
We need to create at least a configuration file to define what kind of services we want to monitor on each node of the cluster. We provide a minimum example that checks some basic services. You can create your own or re-use some of the other services provided by Icinga2.
This is a very powerful tool and as such its configuration files are just as complex. For more information see Service Monitoring.
In the mean time create a file name /etc/icinga2/zones.d/global-templates/mini.conf:
template Host "generic-host" {
  max_check_attempts = 3
  check_interval = 1m
  retry_interval = 30s
  check_command = "hostalive"
}

apply Service "apt"{
  check_command = "apt"
  check_interval = 12h
  retry_interval = 1h
  command_endpoint = host.vars.client_endpoint
  assign where (host.address || host.address6) && host.vars.os == "Linux"
}

apply Service "ping4" {
  check_command = "ping4"
  assign where host.address
}

apply Service "ssh" {
  check_command = "ssh"
  assign where (host.address || host.address6) && host.vars.os == "Linux"
}

apply Service for (http_vhost => config in host.vars.http_vhosts) {
  check_command = "http"
  command_endpoint = host.vars.client_endpoint
  vars += config
  assign where host.vars.client_endpoint
}

apply Service "disk" {
  check_command = "disk"
  command_endpoint = host.vars.client_endpoint
  assign where host.vars.client_endpoint
}

apply Service "icinga" {
  check_command = "icinga"
  command_endpoint = host.vars.client_endpoint
  assign where host.vars.client_endpoint
}

apply Service "load" {
  check_command = "load"
  command_endpoint = host.vars.client_endpoint
  /* Used by the ScheduledDowntime apply rule in `downtimes.conf`. */
  vars.backup_downtime = "02:00-03:00"
  assign where (host.address || host.address6) && host.vars.os == "Linux"
}

apply Service for (procs in host.vars.procs) {
  check_command = "procs"
  vars.procs_critical = "1:"
  vars.procs_command = procs
  command_endpoint = host.vars.client_endpoint
  assign where host.vars.client_endpoint
}

apply Service for (argument in host.vars.runsv) {
  check_command = "procs"
  vars.procs_critical = "1:"
  vars.procs_command = "runsv"
  vars.procs_argument = argument
  command_endpoint = host.vars.client_endpoint
  assign where host.vars.client_endpoint
}

apply Service "procs" {
  check_command = "procs"
  command_endpoint = host.vars.client_endpoint
  assign where host.vars.client_endpoint
}

apply Service "swap" {
  check_command = "swap"
  command_endpoint = host.vars.client_endpoint
  assign where host.vars.client_endpoint
}

apply Service "users" {
  check_command = "users"
  command_endpoint = host.vars.client_endpoint
  assign where host.vars.client_endpoint
}

template User "generic-user" {
}

object User "icingaadmin" {
  import "generic-user"
  enable_notifications = true
  states = [ OK, Warning, Critical ]
  types = [ Problem, Recovery ]
  display_name = "Icinga 2 Admin"
  groups = [ "icingaadmins" ]
  email = "[email protected]"
}

object UserGroup "icingaadmins" {
  display_name = "Icinga 2 Admin Group"
}

apply Notification "mail-icingaadmin" to Host {
  import "mail-host-notification"
  user_groups = host.vars.notification.mail.groups
  users = host.vars.notification.mail.users
  assign where host.vars.notification.mail
}

apply Notification "mail-icingaadmin" to Service {
  import "mail-service-notification"
  user_groups = host.vars.notification.mail.groups
  users = host.vars.notification.mail.users
  assign where host.vars.notification.mail
}

template Notification "mail-host-notification" {
  command = "mail-host-notification"
  states = [ Up, Down ]
  types = [ Problem, Acknowledgement, Recovery, Custom,
            FlappingStart, FlappingEnd,
            DowntimeStart, DowntimeEnd, DowntimeRemoved ]
  vars += {
    notification_logtosyslog = false
  }
  period = "24x7"
}

template Notification "mail-service-notification" {
  command = "mail-service-notification"

  states = [ OK, Warning, Critical, Unknown ]
  types = [ Problem, Acknowledgement, Recovery, Custom,
            FlappingStart, FlappingEnd,
            DowntimeStart, DowntimeEnd, DowntimeRemoved ]
  vars += {
    notification_logtosyslog = false
  }
  period = "24x7"
}

object NotificationCommand "mail-host-notification" {
  command = [ SysconfDir + "/icinga2/scripts/mail-host-notification.sh" ]
  arguments += {
    "-4" = {
      required = true
      value = "$notification_address$"
    }
    "-6" = "$notification_address6$"
    "-b" = "$notification_author$"
    "-c" = "$notification_comment$"
    "-d" = {
      required = true
      value = "$notification_date$"
    }
    "-f" = {
      value = "$notification_from$"
      description = "Set from address. Requires GNU mailutils (Debian/Ubuntu) or mailx (RHEL/SUSE)"
    }
    "-i" = "$notification_icingaweb2url$"
    "-l" = {
      required = true
      value = "$notification_hostname$"
    }
    "-n" = {
      required = true
      value = "$notification_hostdisplayname$"
    }
    "-o" = {
      required = true
      value = "$notification_hostoutput$"
    }
    "-r" = {
      required = true
      value = "$notification_useremail$"
    }
    "-s" = {
      required = true
      value = "$notification_hoststate$"
    }
    "-t" = {
      required = true
      value = "$notification_type$"
    }
    "-v" = "$notification_logtosyslog$"
  }
  vars += {
    notification_address = "$address$"
    notification_address6 = "$address6$"
    notification_author = "$notification.author$"
    notification_comment = "$notification.comment$"
    notification_type = "$notification.type$"
    notification_date = "$icinga.long_date_time$"
    notification_hostname = "$host.name$"
    notification_hostdisplayname = "$host.display_name$"
    notification_hostoutput = "$host.output$"
    notification_hoststate = "$host.state$"
    notification_useremail = "$user.email$"
  }
}

object NotificationCommand "mail-service-notification" {
  command = [ SysconfDir + "/icinga2/scripts/mail-service-notification.sh" ]
  arguments += {
    "-4" = {
      required = true
      value = "$notification_address$"
        }
    "-6" = "$notification_address6$"
    "-b" = "$notification_author$"
    "-c" = "$notification_comment$"
    "-d" = {
      required = true
      value = "$notification_date$"
    }
    "-e" = {
      required = true
      value = "$notification_servicename$"
    }
    "-f" = {
      value = "$notification_from$"
      description = "Set from address. Requires GNU mailutils (Debian/Ubuntu) or mailx (RHEL/SUSE)"
    }
    "-i" = "$notification_icingaweb2url$"
    "-l" = {
      required = true
      value = "$notification_hostname$"
    }
    "-n" = {
      required = true
      value = "$notification_hostdisplayname$"
    }
    "-o" = {
      required = true
      value = "$notification_serviceoutput$"
    }
    "-r" = {
      required = true
      value = "$notification_useremail$"
    }
    "-s" = {
      required = true
      value = "$notification_servicestate$"
    }
    "-t" = {
      required = true
      value = "$notification_type$"
    }
    "-u" = {
      required = true
      value = "$notification_servicedisplayname$"
    }
    "-v" = "$notification_logtosyslog$"
  }
  vars += {
    notification_address = "$address$"
    notification_address6 = "$address6$"
    notification_author = "$notification.author$"
    notification_comment = "$notification.comment$"
    notification_type = "$notification.type$"
    notification_date = "$icinga.long_date_time$"
    notification_hostname = "$host.name$"
    notification_hostdisplayname = "$host.display_name$"
    notification_servicename = "$service.name$"
    notification_serviceoutput = "$service.output$"
    notification_servicestate = "$service.state$"
    notification_useremail = "$user.email$"
    notification_servicedisplayname = "$service.display_name$"
  }
}

object TimePeriod "24x7" {
  import "legacy-timeperiod"
  display_name = "Icinga 2 24x7 TimePeriod"
  ranges = {
    "monday" 	= "00:00-24:00"
    "tuesday" 	= "00:00-24:00"
    "wednesday" = "00:00-24:00"
    "thursday" 	= "00:00-24:00"
    "friday" 	= "00:00-24:00"
    "saturday" 	= "00:00-24:00"
    "sunday" 	= "00:00-24:00"
  }
}
And now restart your newly installed Master:
service icinga2 restart
WebUI
The first step is to install the package:
apt install icingaweb2 libapache2-mod-php icingacli
If all went well, you should now be able to access your IcingaWeb2 in the url http://monitor.yourdomain.com/icingaweb2/
Because we have not yet setup security, you won’t be able to login just yet. Lets get going.
Next step is to configure your WebUI tokens:
icingacli setup config directory --group icingaweb2
icingacli setup token create
Grab the setup token generated in the last step and go to http://monitor.yourdomain.com/icingaweb2/setup , input the generated token and click “Next”:

In the next step you are prompted to select which modules you want to install, the default of just “Monitoring” its fine:

Now IcingaWeb2 will analyze which php modules and configurations you have setup already in that server and will present a report with its findings, similar to this:
Make sure to make the necessary configuration corrections and install the required modules, in our example we need to set the timezone in php.ini, we do so by editing /etc/php/7.0/apache2/php.ini:
date.timezone = 'America/Buenos_Aires'
Adjust the timezone accordingly to your location obviously.
Then we install the missing php modules required and we restart Apache:
apt install php-gd php-imagick php-intl
service apache2 restart
I’m not installing the PostgreSQL modules because we are not using that database engine for this tutorial.
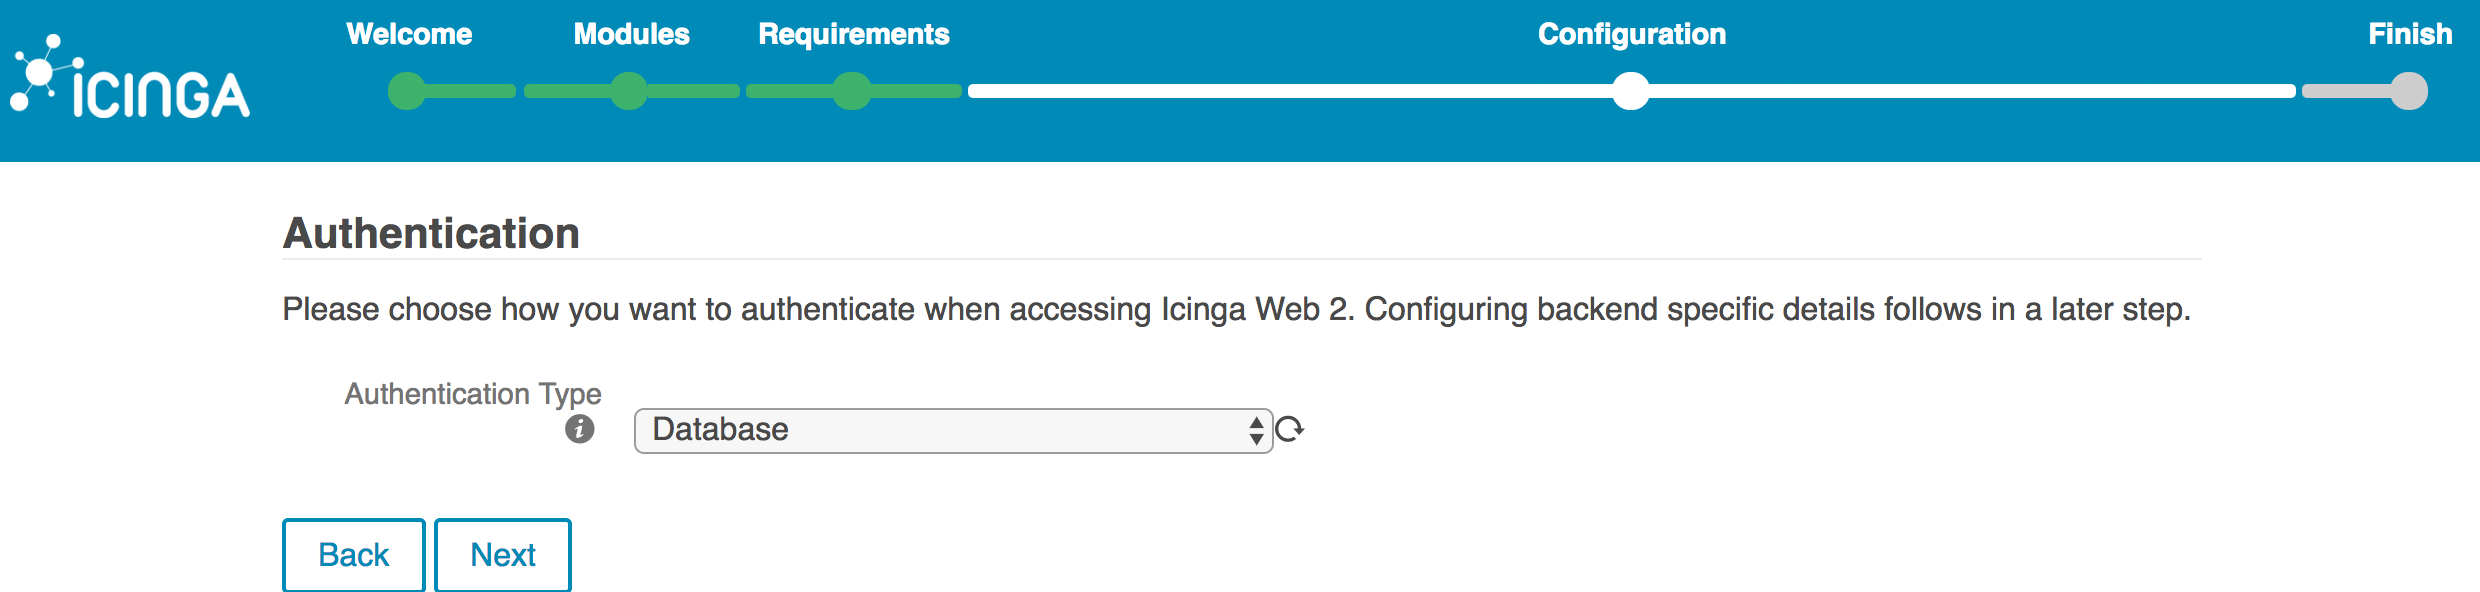
Back on the browser we hit the refresh button and see that the list of dependencies gets updated if all went well, we click next and select our authentication type. If you don’t have an LDAP service or External Authentication available, select “database” and click next:
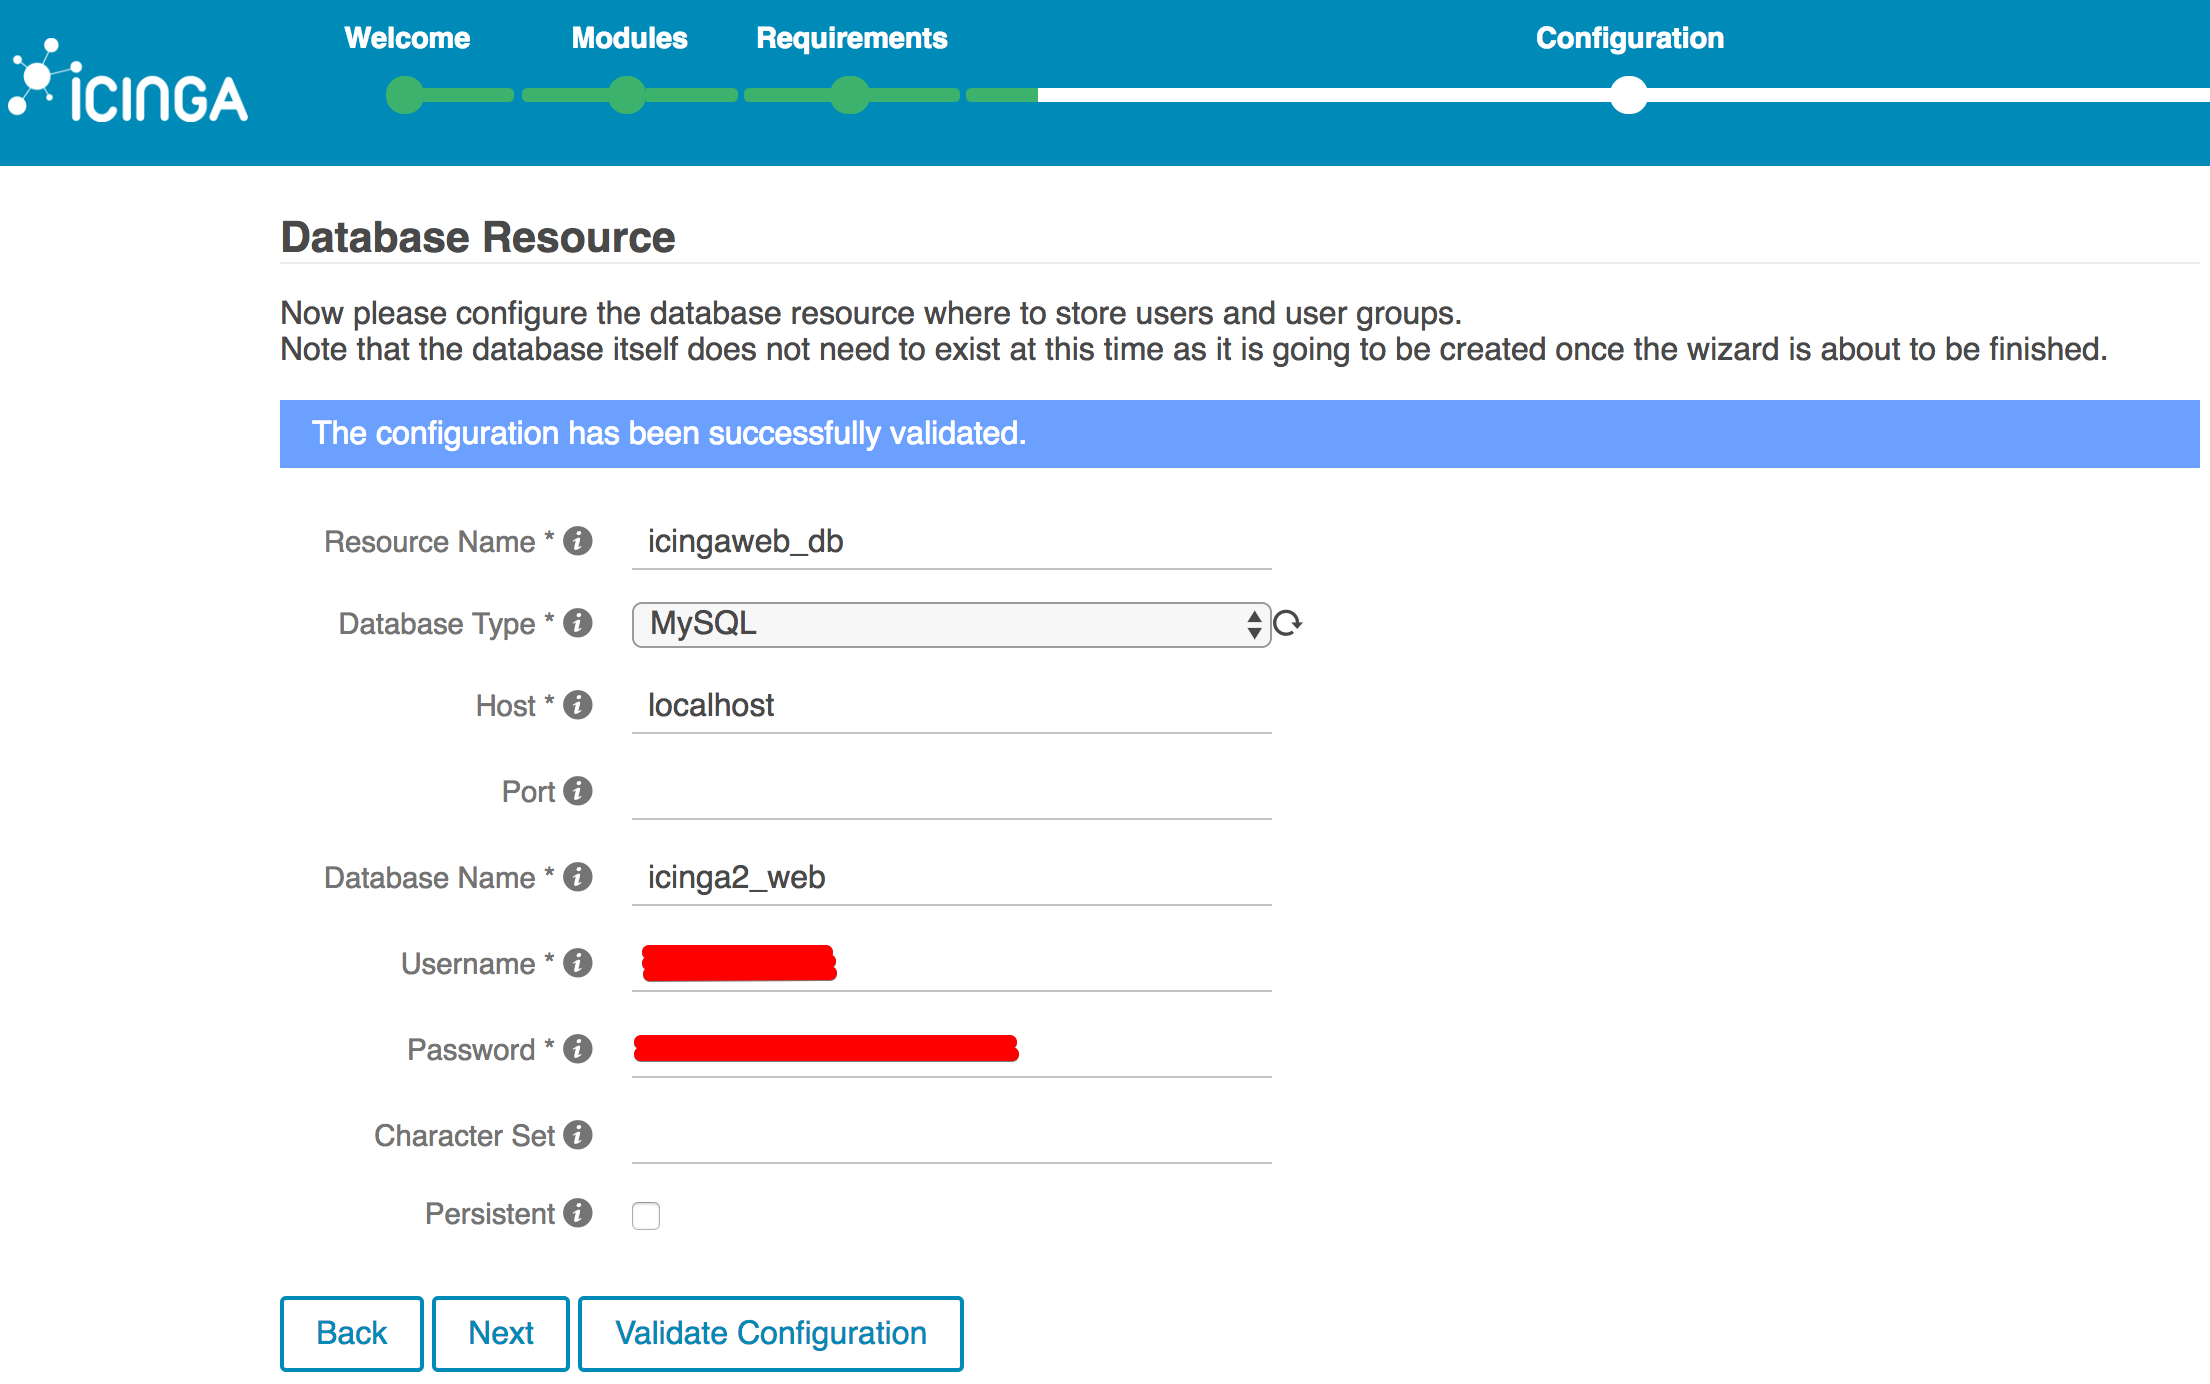
Now fill in the connection information for your IcingaWeb2 database, this is not the same database used by Icinga2, so please create a new database and set of credentials accordingly and fill in that information in this form. Click “Validate Configuration” and if it the connection was successful you can click “Next”
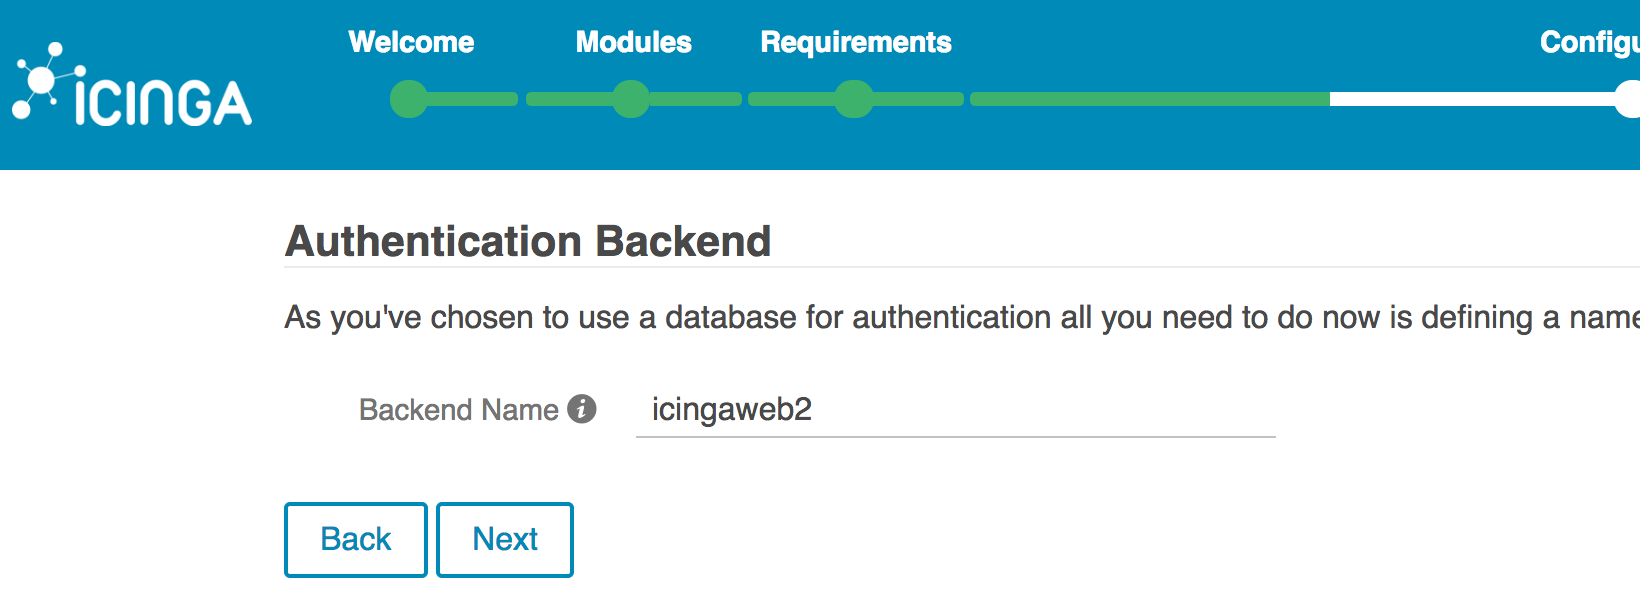
If you selected the “database” authentication backend, you’ll need to name it in this step, the default works just fine. Click “Next”:
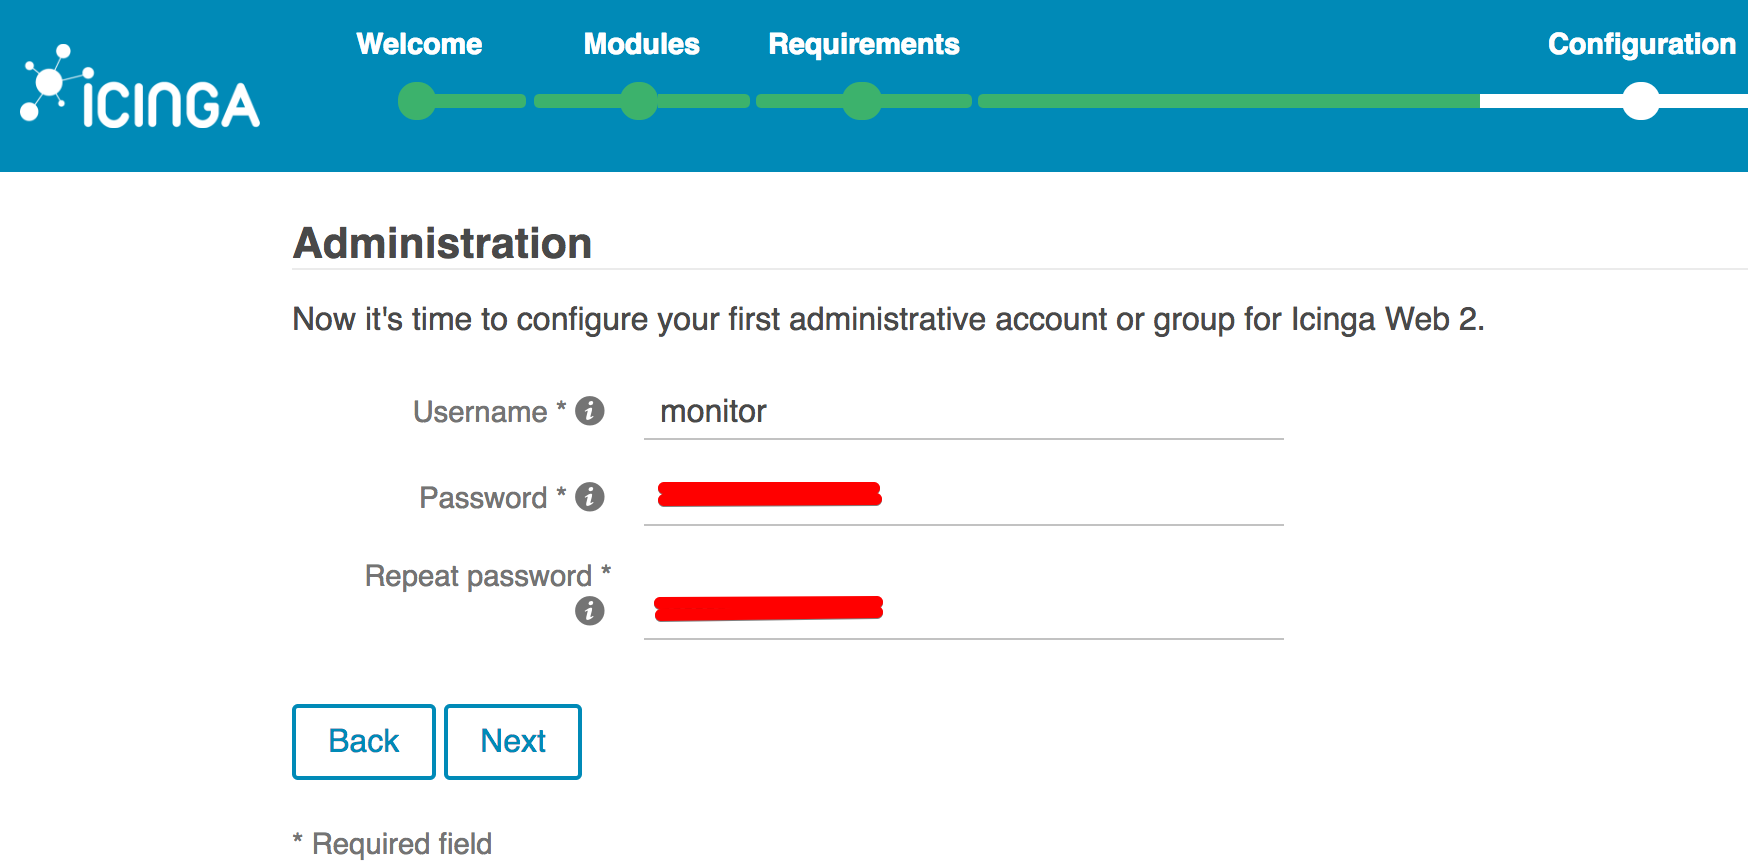
On the next step you’ll setup the admin username and password for your WebUI, as always use strong passwords:
Now you need to select where to store the WebUI configurations, were to log and the logging level, we are going to select the defaults:

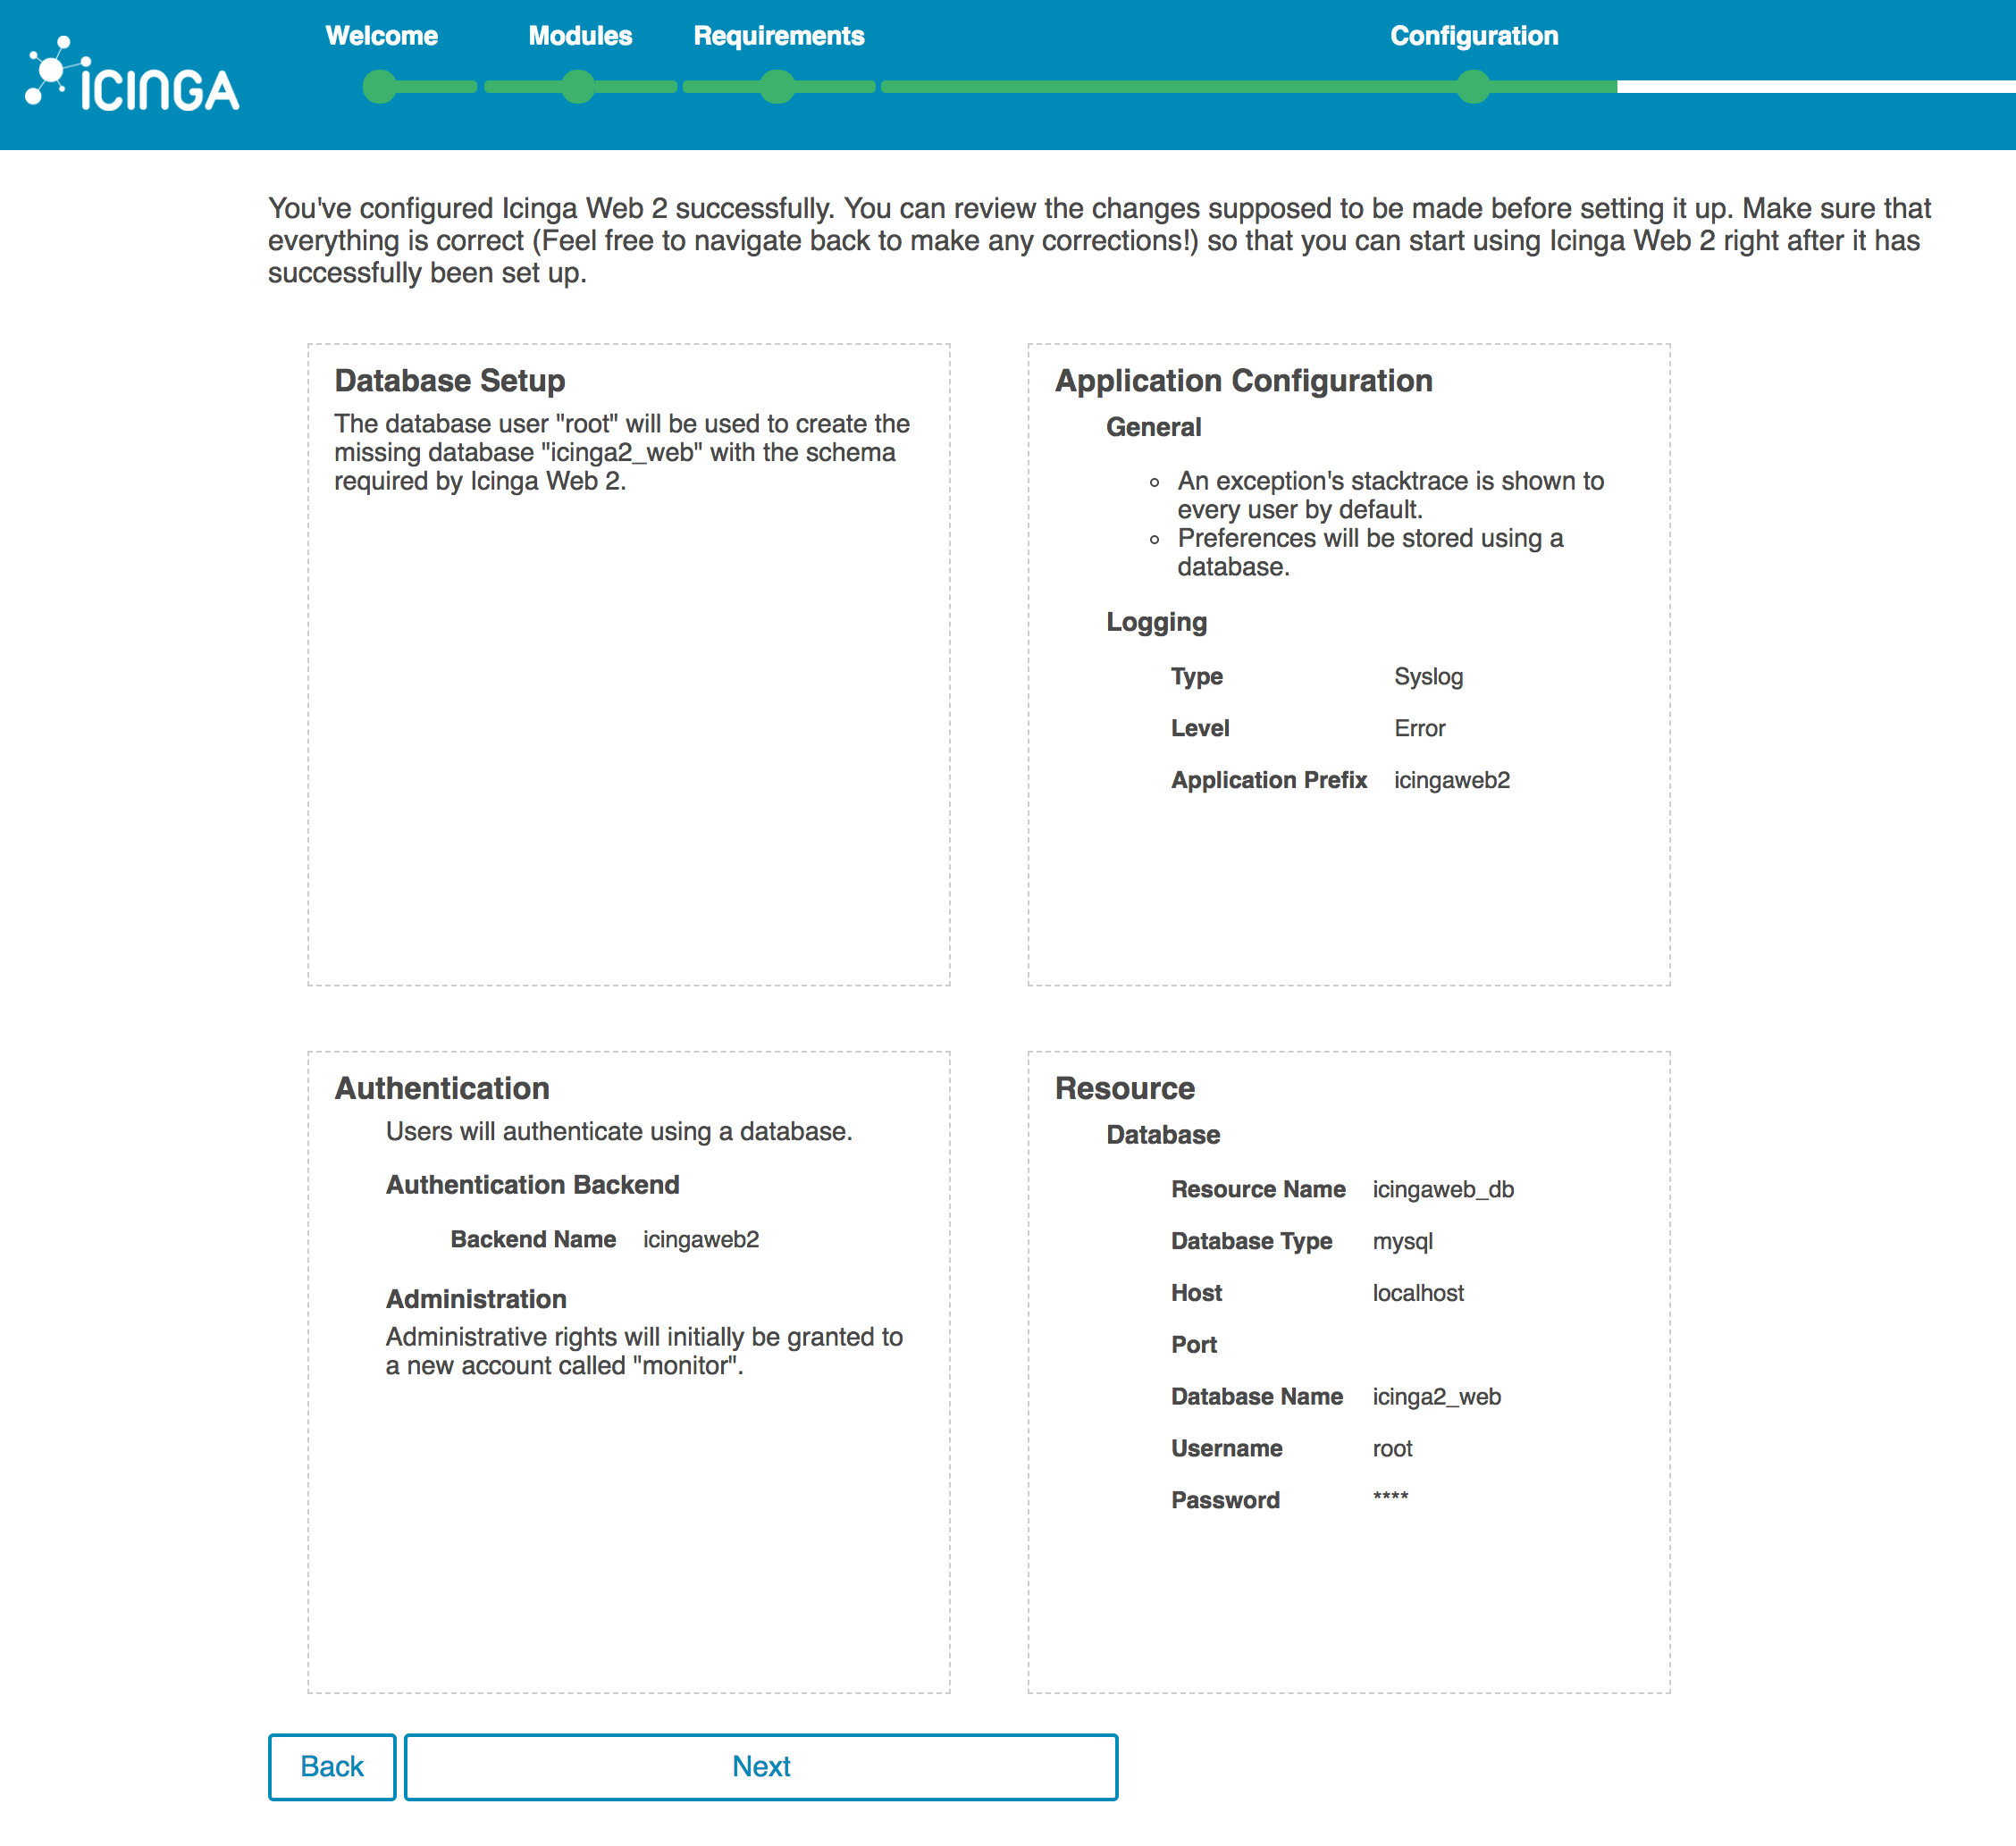
And now we will see a summary of all the settings we have been putting in in the wizard, review one last time and if all looks good click “Next” so we can setup the Monitoring module:
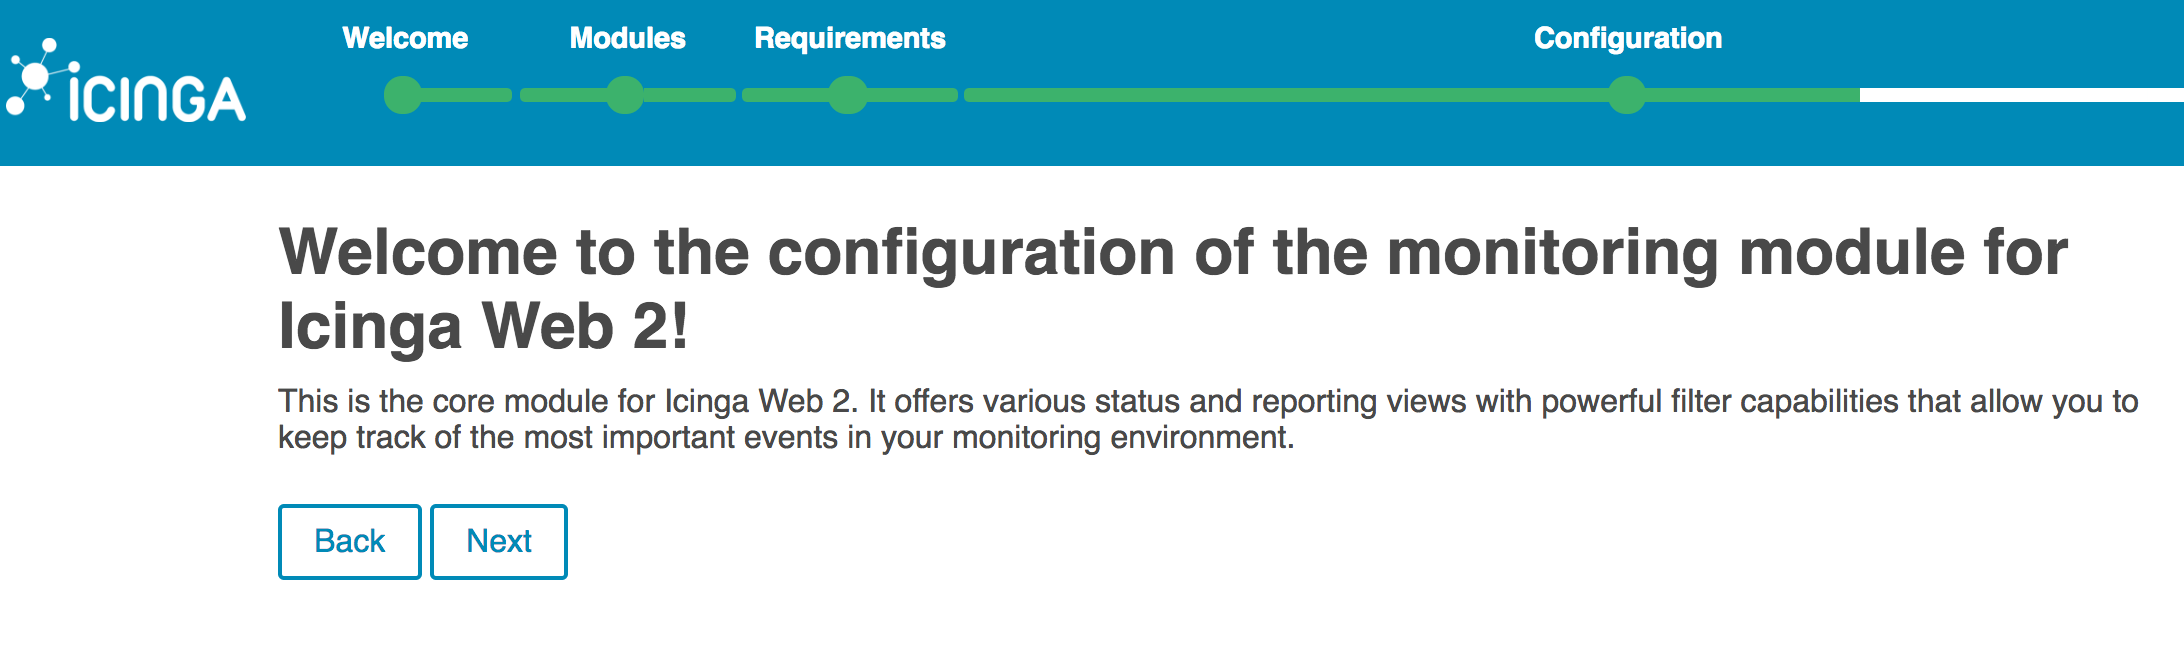
We start the wizard to setup the Monitoring module by clicking “Next”:
The first step is to select the Monitoring backend we want to use. We will have the WebUI pull data from the icinga2-ido-mysql module that we configured in the Server section by just clicking “Next”:
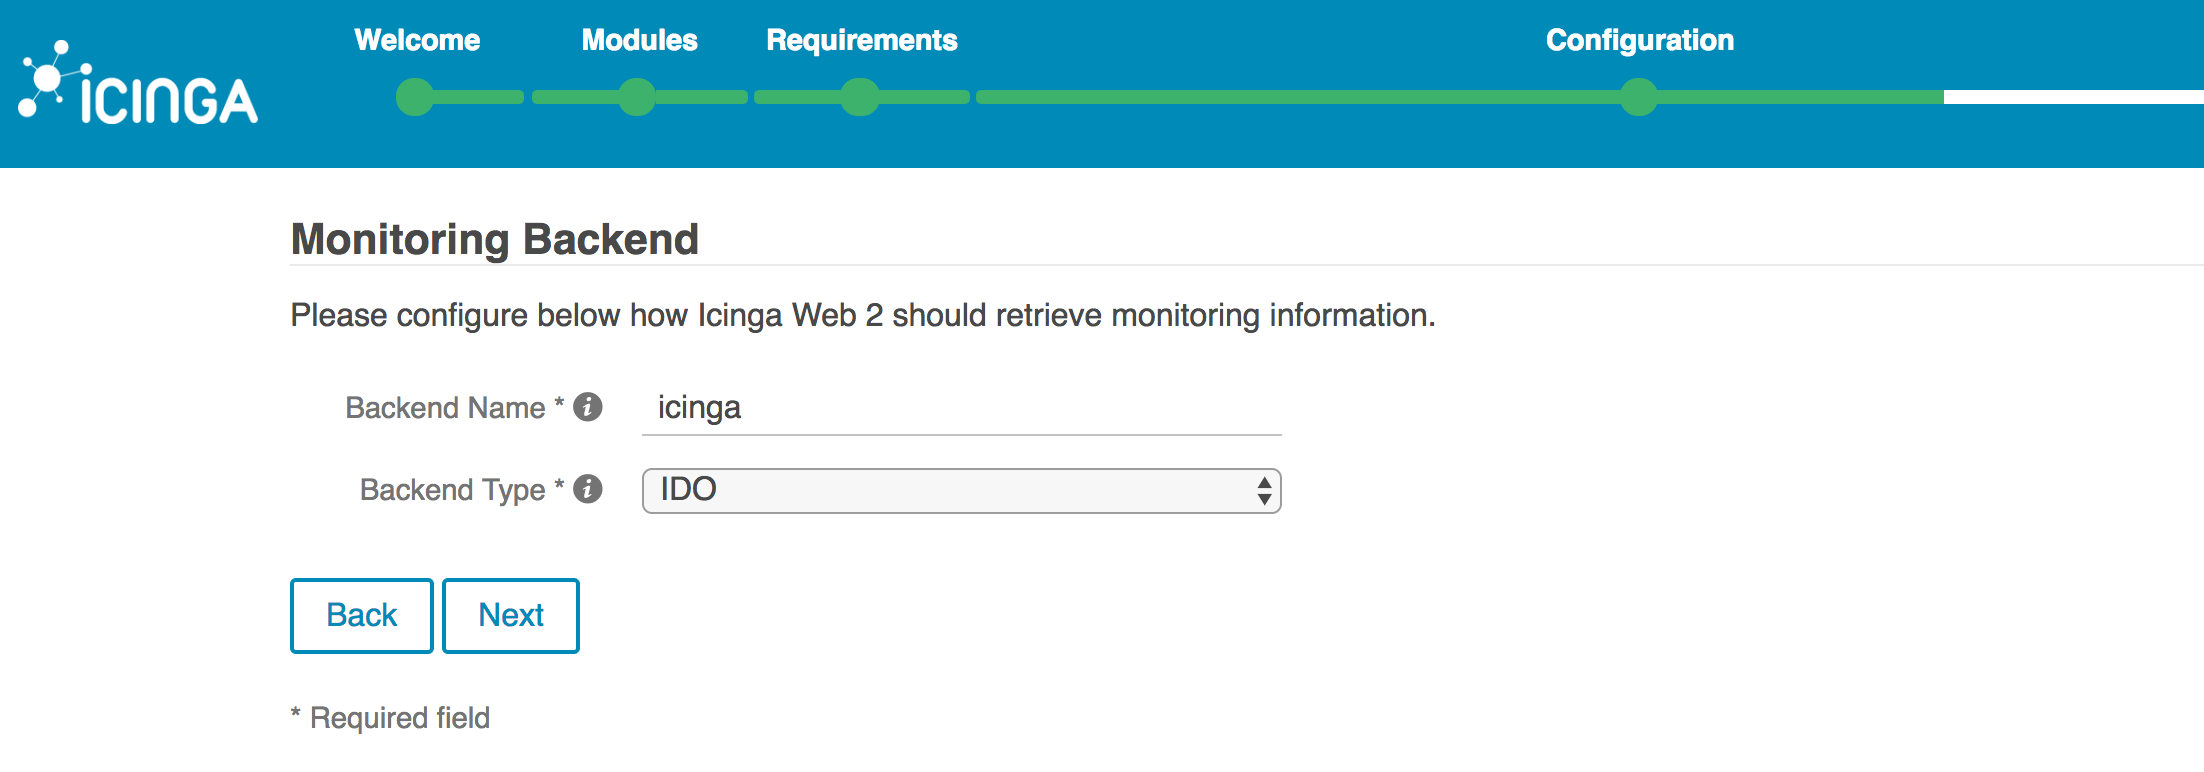
Now fill in the details for the icinga2 database that you set up in the Server section and click “Validate Configuration”. If all works, click “Next”

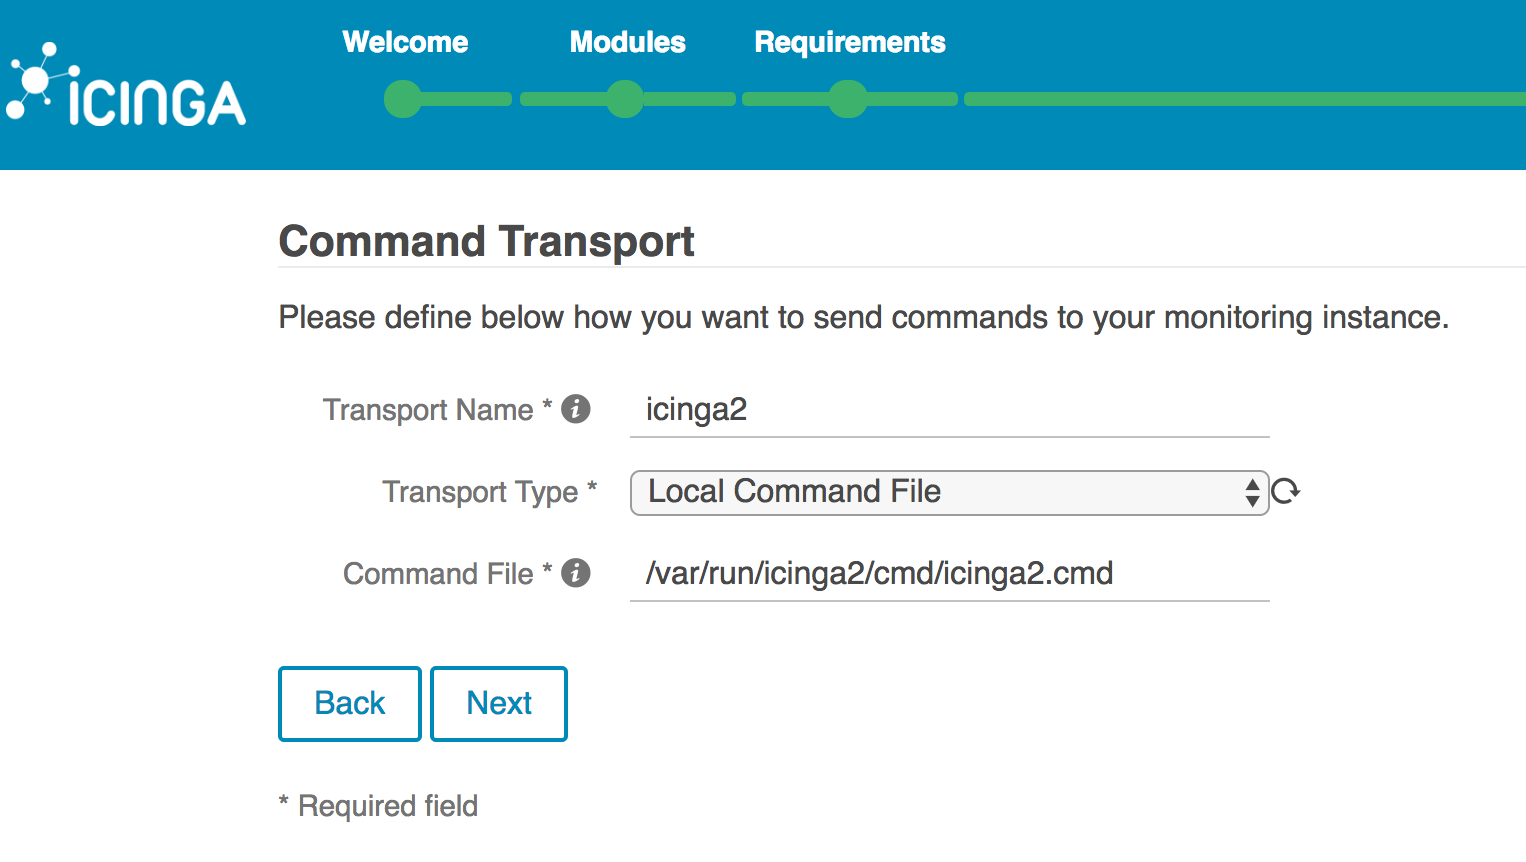
The Command Transport defines how the WebUI is going to send monitoring commands to the nodes, like “Recheck status” or “Mute notifications”. We select “Local Command File” here. Click “Next”
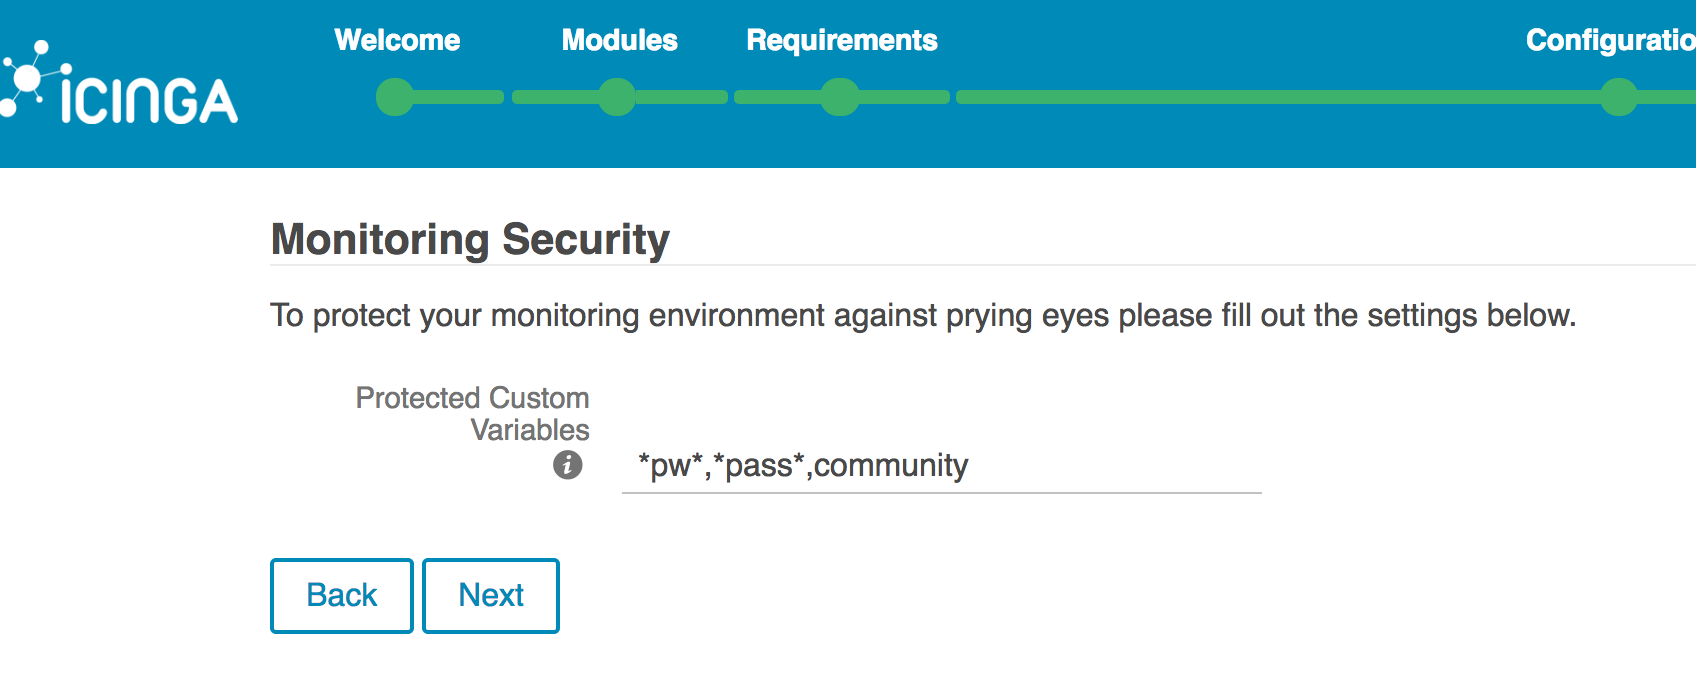
Now we can input a regex the WebUI will use to obfuscate information presented in the website and that goes out in notifications. If you are going to define any customemetrics that you don’t want visible in notifications, please add the name of the variables to protect here.
If you don’t have any custom variables just click “Next”.
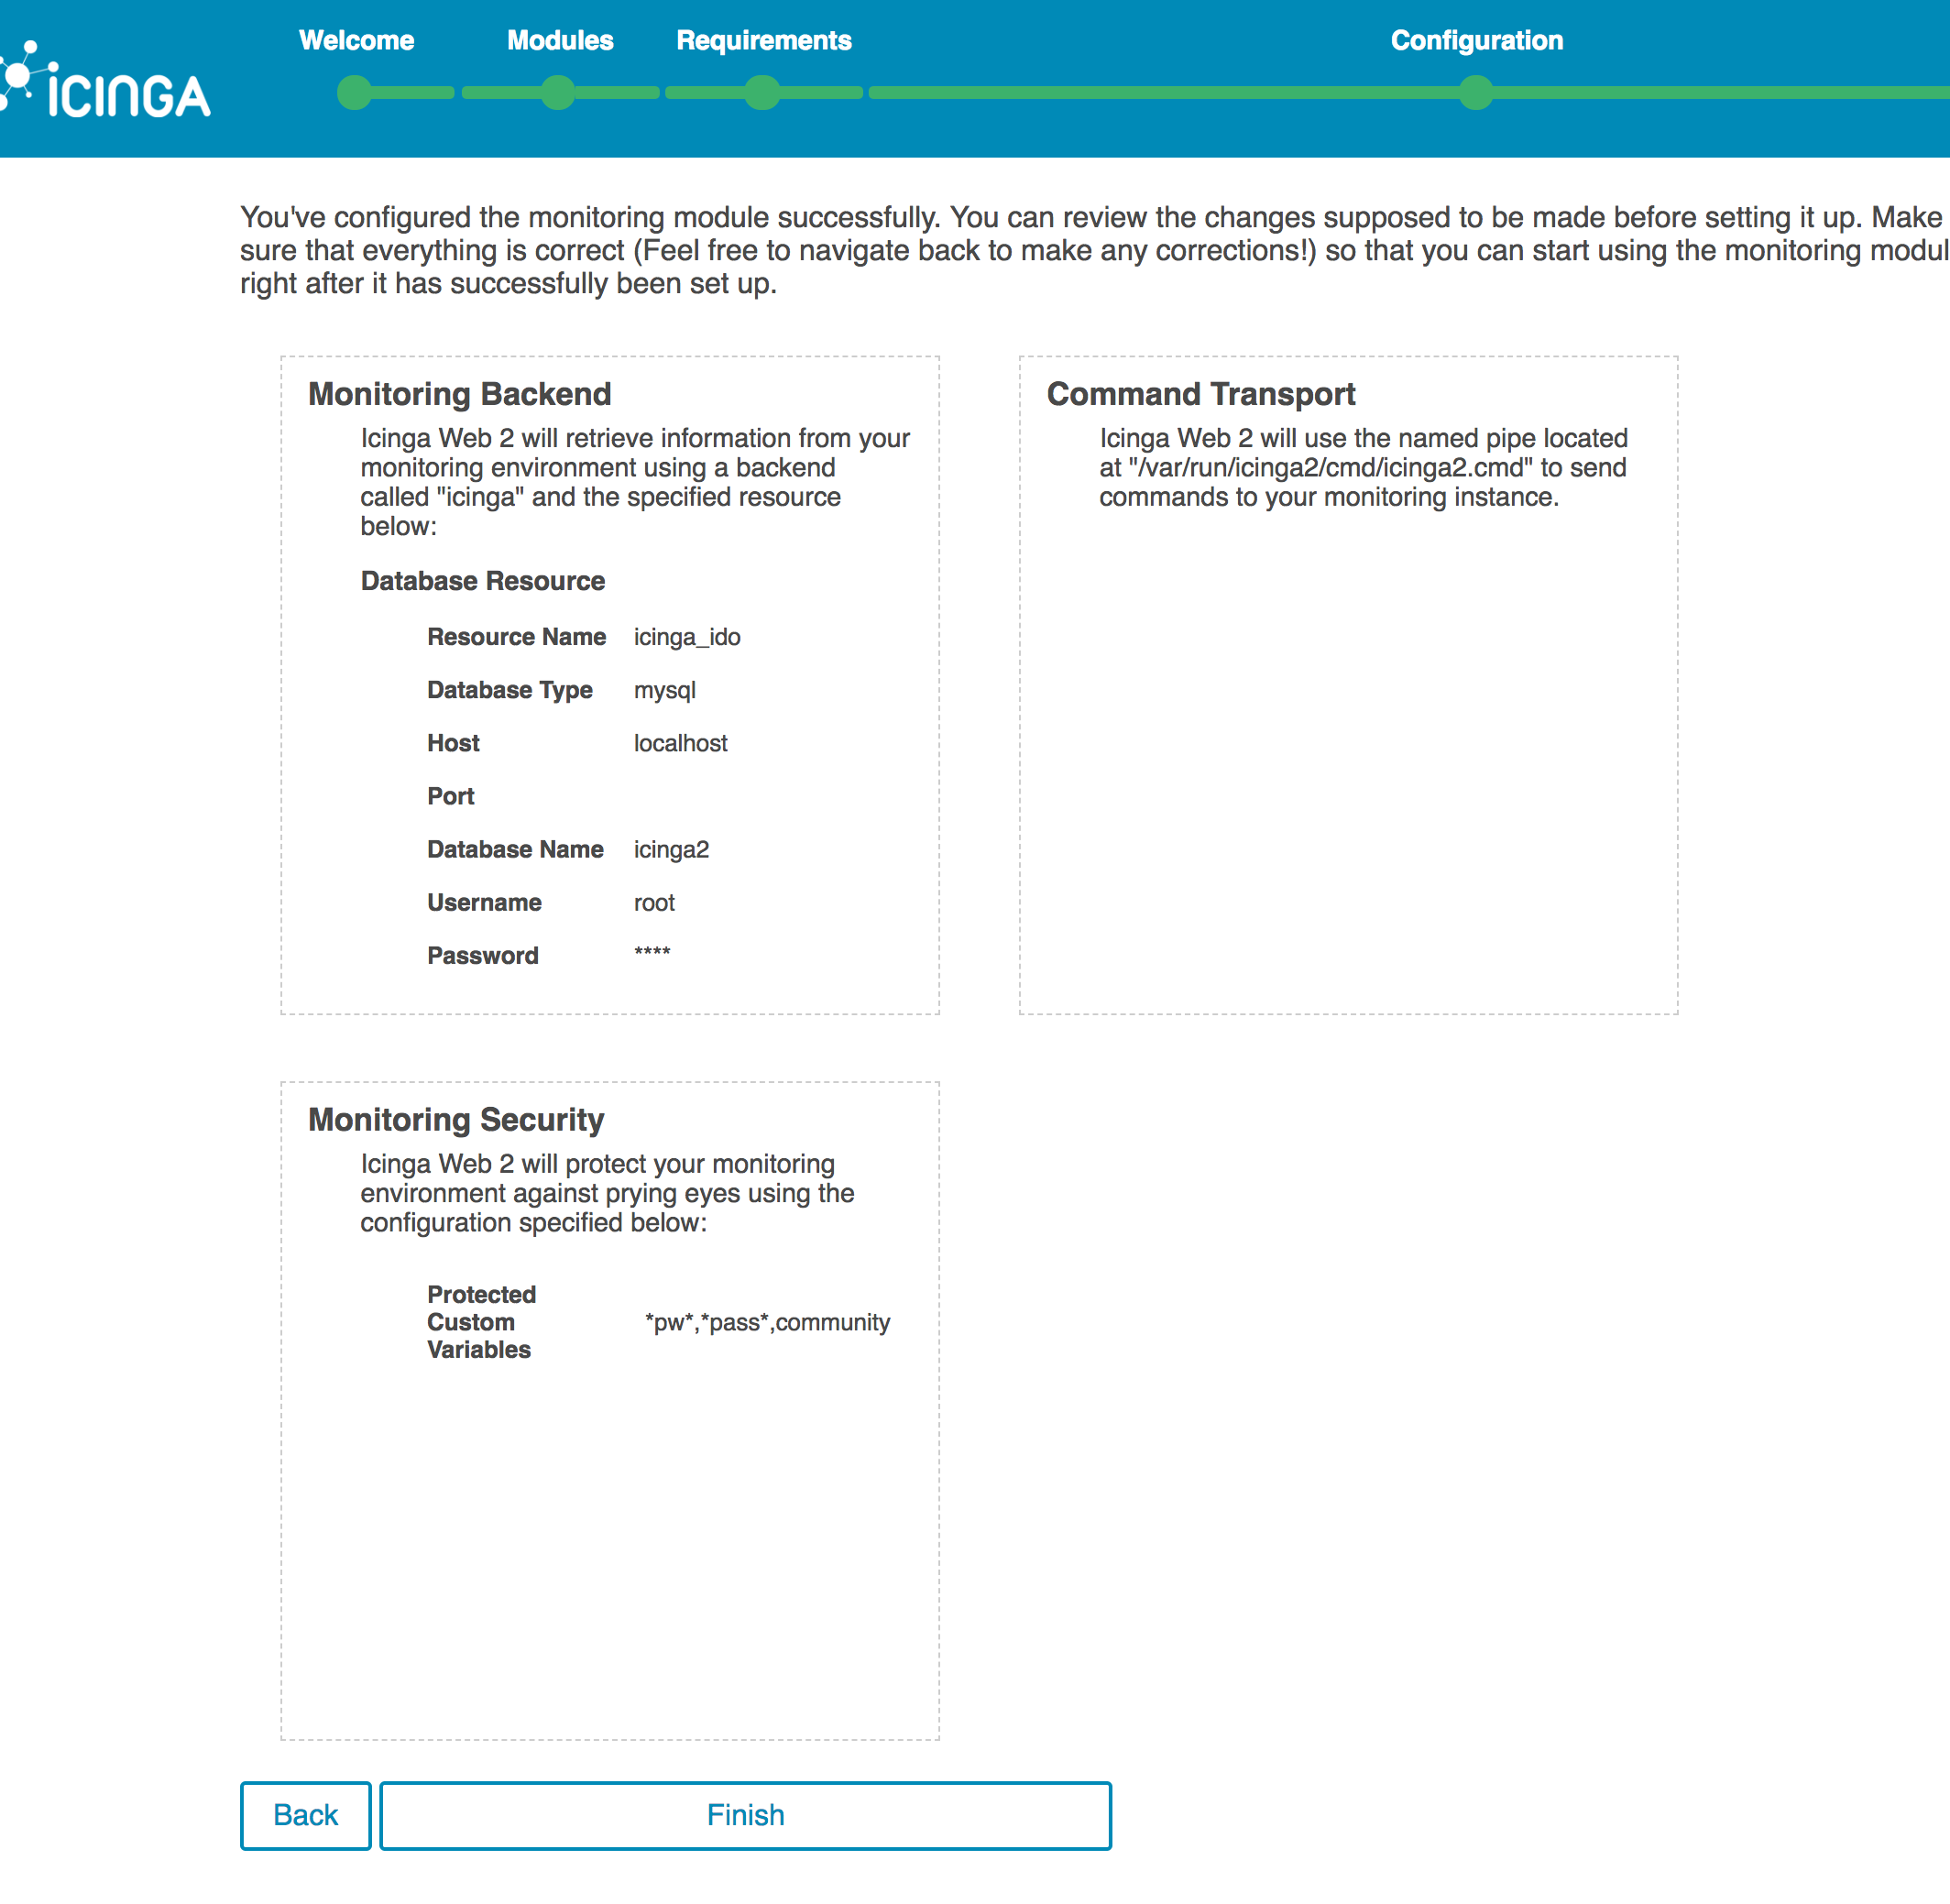
As when we setup the webui before, now get at page to check all our selected settings. Review and if all looks good, click “Finish”:
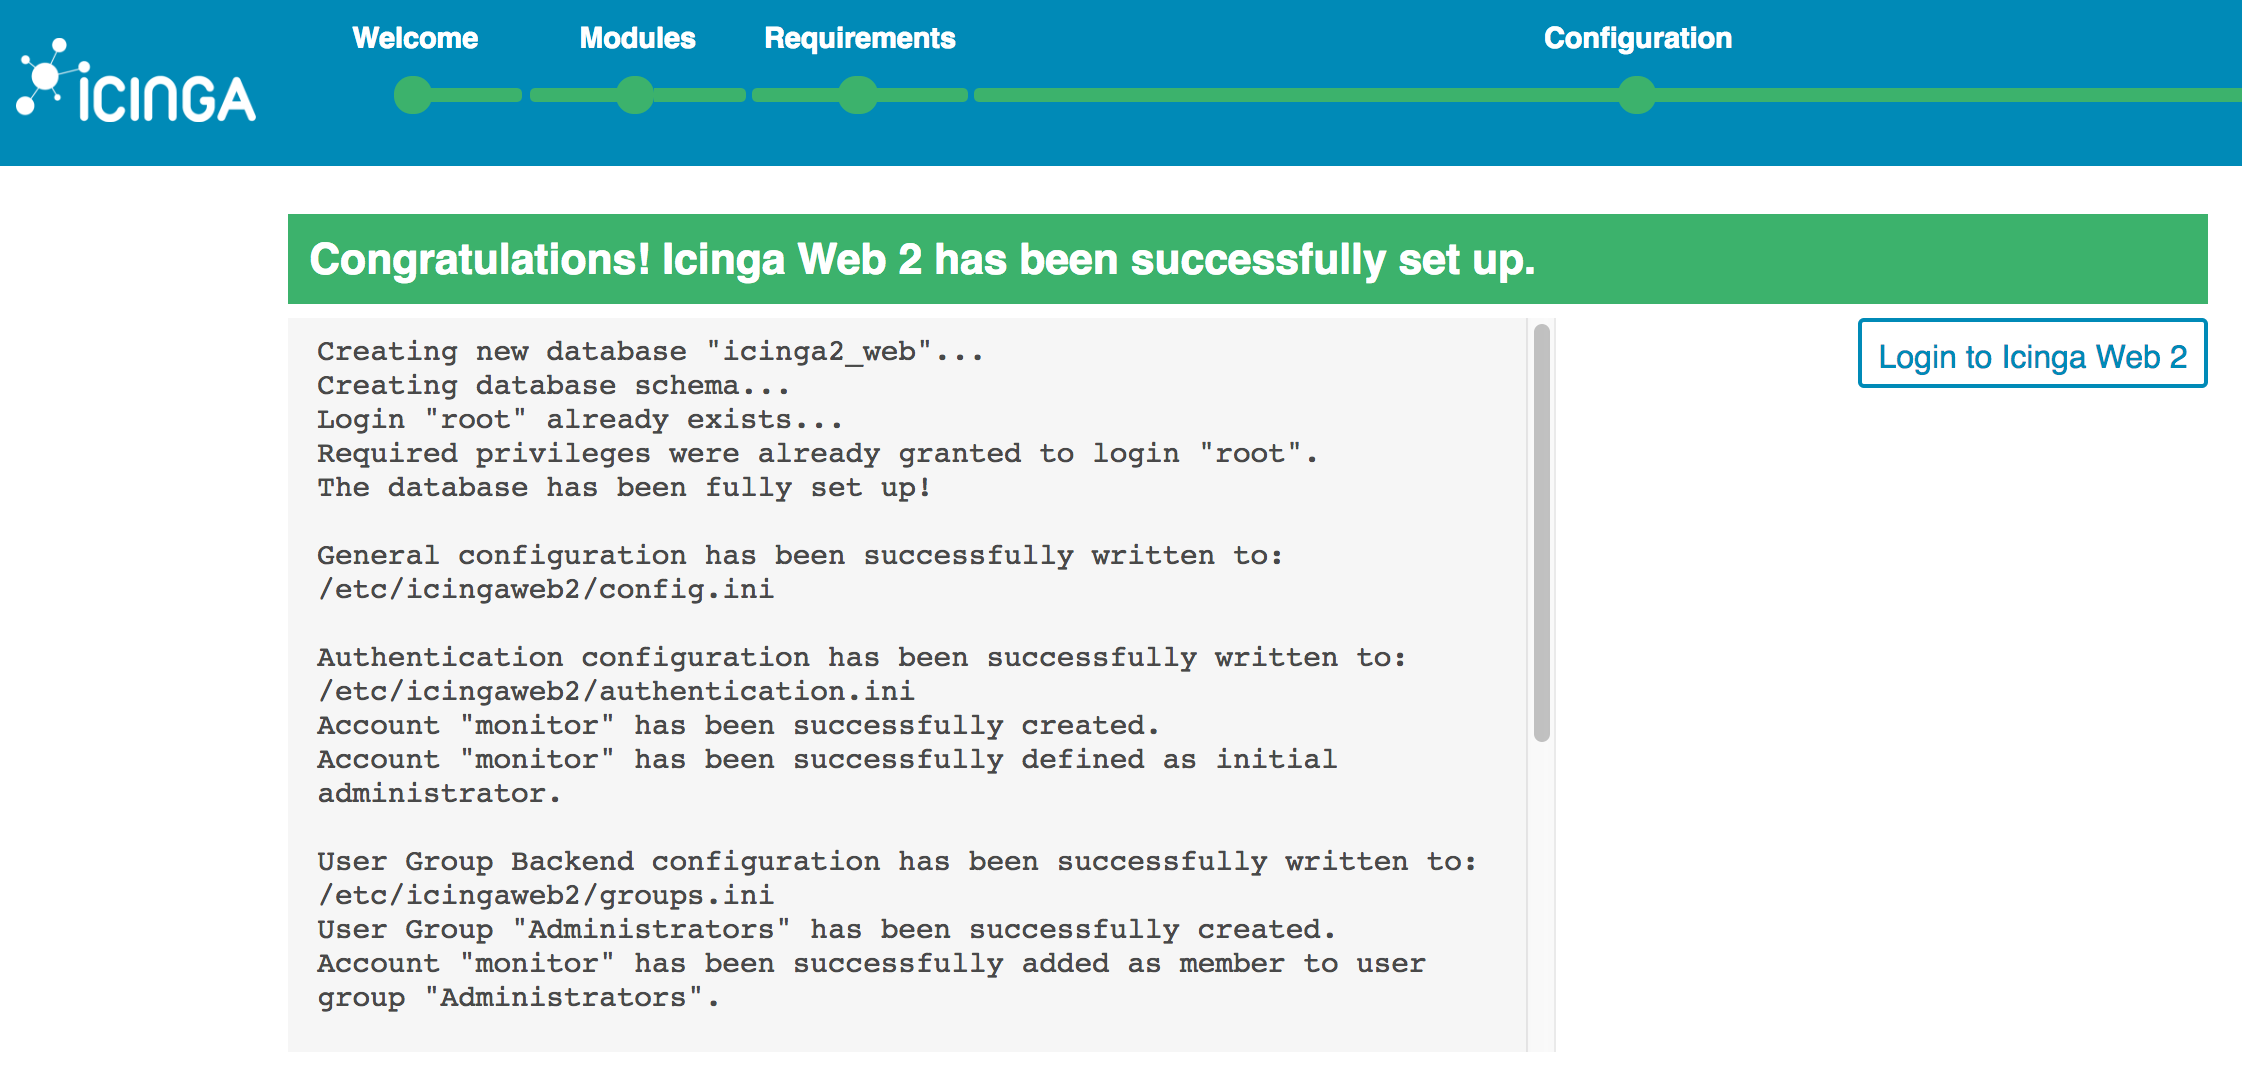
Now you can finally log in to your monitoring instance:

Make sure to look around to get acquainted with the tool, there is a lot of useful information that will get collected here once you setup your Nodes like:
- Problems occurring right now
- Overview of all the Nodes you setup
- History of all incidents
Nodes
This section shows how to setup each of the nodes that we want to collect metrics on to be reported to the Icinga2 Master Node.
First setup the repos just like we did in the Server section:
wget -O - https://packages.icinga.com/icinga.key | apt-key add -
echo "deb http://packages.icinga.com/ubuntu icinga-xenial main" >> /etc/apt/sources.d/icinga2.list
echo "deb-src http://packages.icinga.com/ubuntu icinga-xenial main" >> /etc/apt/sources.d/icinga2.list
apt update
Then we install Icinga2 and the monitoring-plugins package:
apt install icinga2 monitoring-plugins
We know need to get a token for each node from the Server, to do that when logged in as root we’ll run:
icinga2 pki ticket --cn 'node1.yourdomain.com'
Save that token, you’ll need it in the next step when setting up the node wizard. To get that started run:
icinga2 node wizard
In each one of the nodes you are setting up, here is an example of the command output and the inputs you need to provide are bold:
Welcome to the Icinga 2 Setup Wizard!

We'll guide you through all required configuration details.

Please specify if this is a satellite setup ('n' installs a master setup) [Y/n]:
<enter>
Starting the Node setup routine...
Please specifiy the common name (CN) [node1.42mate.com]:
Please specifiy the local zone name [node1.42mate.com]:
Please specify the master endpoint(s) this node should connect to:
Master Common Name (CN from your master setup):
monitor.yourdomain.com
Do you want to establish a connection to the master from this node? [Y/n]:
<enter>
Please fill out the master connection information:
Master endpoint host (Your master's IP address or FQDN):
monitor.yourdomain.com
Master endpoint port [5665]:
<enter>
Add more master endpoints? [y/N]:
<enter>
Please specify the master connection for CSR auto-signing (defaults to master endpoint host):
Host [monitor.yourdomain.com]:
<enter>
Port [5665]:
<enter>
information/base: Writing private key to '/etc/icinga2/pki/node1.yourdomain.com.key'.
information/base: Writing X509 certificate to '/etc/icinga2/pki/node1.yourdomain.com.crt'.
information/cli: Fetching public certificate from master (t1.deimos.42mate.com, 5665):

Certificate information:

Subject: CN = monitor.yourdomain.com
Issuer: CN = Icinga CA
Valid From: Jul 20 22:44:45 2018 GMT
Valid Until: Jul 16 22:44:45 2033 GMT
Fingerprint: EB AD 9F 80 F9 59 9C 22 10 64 BF 47 A3 DD 04 77 D7 BD 64 C7

Is this information correct? [y/N]:
y
information/cli: Received trusted master certificate.

Please specify the request ticket generated on your Icinga 2 master.
(Hint: # icinga2 pki ticket --cn 'node1.yourdomain.com'): 4997a5f64845b73ce591ccd95dbeee812adc8ef9
information/cli: Requesting certificate with ticket '4997a5f64845b73ce591ccd95dbeee812adc8ef9'.

information/cli: Created backup file '/etc/icinga2/pki/node1.yourdomain.com.crt.orig'.
information/cli: Writing signed certificate to file '/etc/icinga2/pki/node1.yourdomain.com.crt'.
information/cli: Writing CA certificate to file '/etc/icinga2/pki/ca.crt'.
Please specify the API bind host/port (optional):
Bind Host []:
<enter>
Bind Port []:
<enter>
Accept config from master? [y/N]:
y
Accept commands from master? [y/N]:
y
information/cli: Disabling the Notification feature.
Disabling feature notification. Make sure to restart Icinga 2 for these changes to take effect.
information/cli: Enabling the Apilistener feature.
Enabling feature api. Make sure to restart Icinga 2 for these changes to take effect.
information/cli: Created backup file '/etc/icinga2/features-available/api.conf.orig'.
information/cli: Generating local zones.conf.
information/cli: Dumping config items to file '/etc/icinga2/zones.conf'.
information/cli: Created backup file '/etc/icinga2/zones.conf.orig'.
information/cli: Updating constants.conf.
information/cli: Created backup file '/etc/icinga2/constants.conf.orig'.
information/cli: Updating constants file '/etc/icinga2/constants.conf'.
information/cli: Updating constants file '/etc/icinga2/constants.conf'.
Done.

Now restart your Icinga 2 daemon to finish the installation!
Now enable the commands and api features and disable the checker feature:
icinga2 feature enable command
icinga2 feature enable api
icinga2 feature disable checker
Edit the file /etc/icinga2/icinga2.conf and comment out or remove the inclusion of the conf.d directory since we will be receiving all configurations from the Master node. This one line can comment out the line if you’d rather not do it manually:
sed -i 's@^include_recursive "conf.d"@//include_recursive "conf.d"@g' /etc/icinga2/icinga2.conf
Now enable the reception of global-templates from the Master node in /etc/icinga2/zones.conf:
cat <<EOF >>/etc/icinga2/zones.conf
object Zone "global-templates" {
  global = true
}
EOF
Restart your newly installed node:
service icinga2 restart
Back to the Server
Once you are done installing Icinga2 on your nodes you’ll need to add a configuration file for each node you want to monitor.
This files are located in /etc/icinga2/zones.d/master and Icinga2 will automatically read any file that has the “.conf” extension. It is a good practice to use the hostname of the server you are describing to name the configuration files. So for this example we will create 2 files to monitor 2 servers:
/etc/icinga2/zones.d/master/node1.yourdomain.com:
object Host "node1.yourdomain.com" {
  check_command = "hostalive"
  /* Import the default host template defined in `templates.conf`. */
  import "generic-host"

  vars.client_endpoint = name

  /* Specify the address attributes for checks e.g. `ssh` or `http`. */
  address = "127.0.0.1"
  address6 = "::1"

  /* Set custom attribute `os` for hostgroup assignment in `groups.conf`. */
  vars.os = "Linux"

  vars.disks["disk /"] = {
    disk_partitions = "/"
  }

  /* Define notification mail attributes for notification apply rules in `notifications.conf`. */
  vars.notification["mail"] = {
    /* The UserGroup `icingaadmins` is defined in `users.conf`. */
    groups = [ "icingaadmins" ]
  }
}

object Endpoint "node1.yourdomain.com" {
    host = "node1.yourdomain.com"
}

object Zone "node1.yourdomain.com" {
    endpoints = [ "node1.yourdomain.com" ]
    parent = "master"
}
/etc/icinga2/zones.d/master/node2.yourdomain.com:
object Host "node2.yourdomain.com" {
  check_command = "hostalive"
  /* Import the default host template defined in `templates.conf`. */
  import "generic-host"

  vars.client_endpoint = name

  /* Specify the address attributes for checks e.g. `ssh` or `http`. */
  address = "127.0.0.1"
  address6 = "::1"

  /* Set custom attribute `os` for hostgroup assignment in `groups.conf`. */
  vars.os = "Linux"

  vars.disks["disk /"] = {
    disk_partitions = "/"
  }

  /* Define notification mail attributes for notification apply rules in `notifications.conf`. */
  vars.notification["mail"] = {
    /* The UserGroup `icingaadmins` is defined in `users.conf`. */
    groups = [ "icingaadmins" ]
  }
}

object Endpoint "node2.yourdomain.com" {
    host = "node2.yourdomain.com"
}

object Zone "node2.yourdomain.com" {
    endpoints = [ "node2.yourdomain.com" ]
    parent = "master"
}
Now you can restart the Icinga2 one final time:
service icinga2 restart
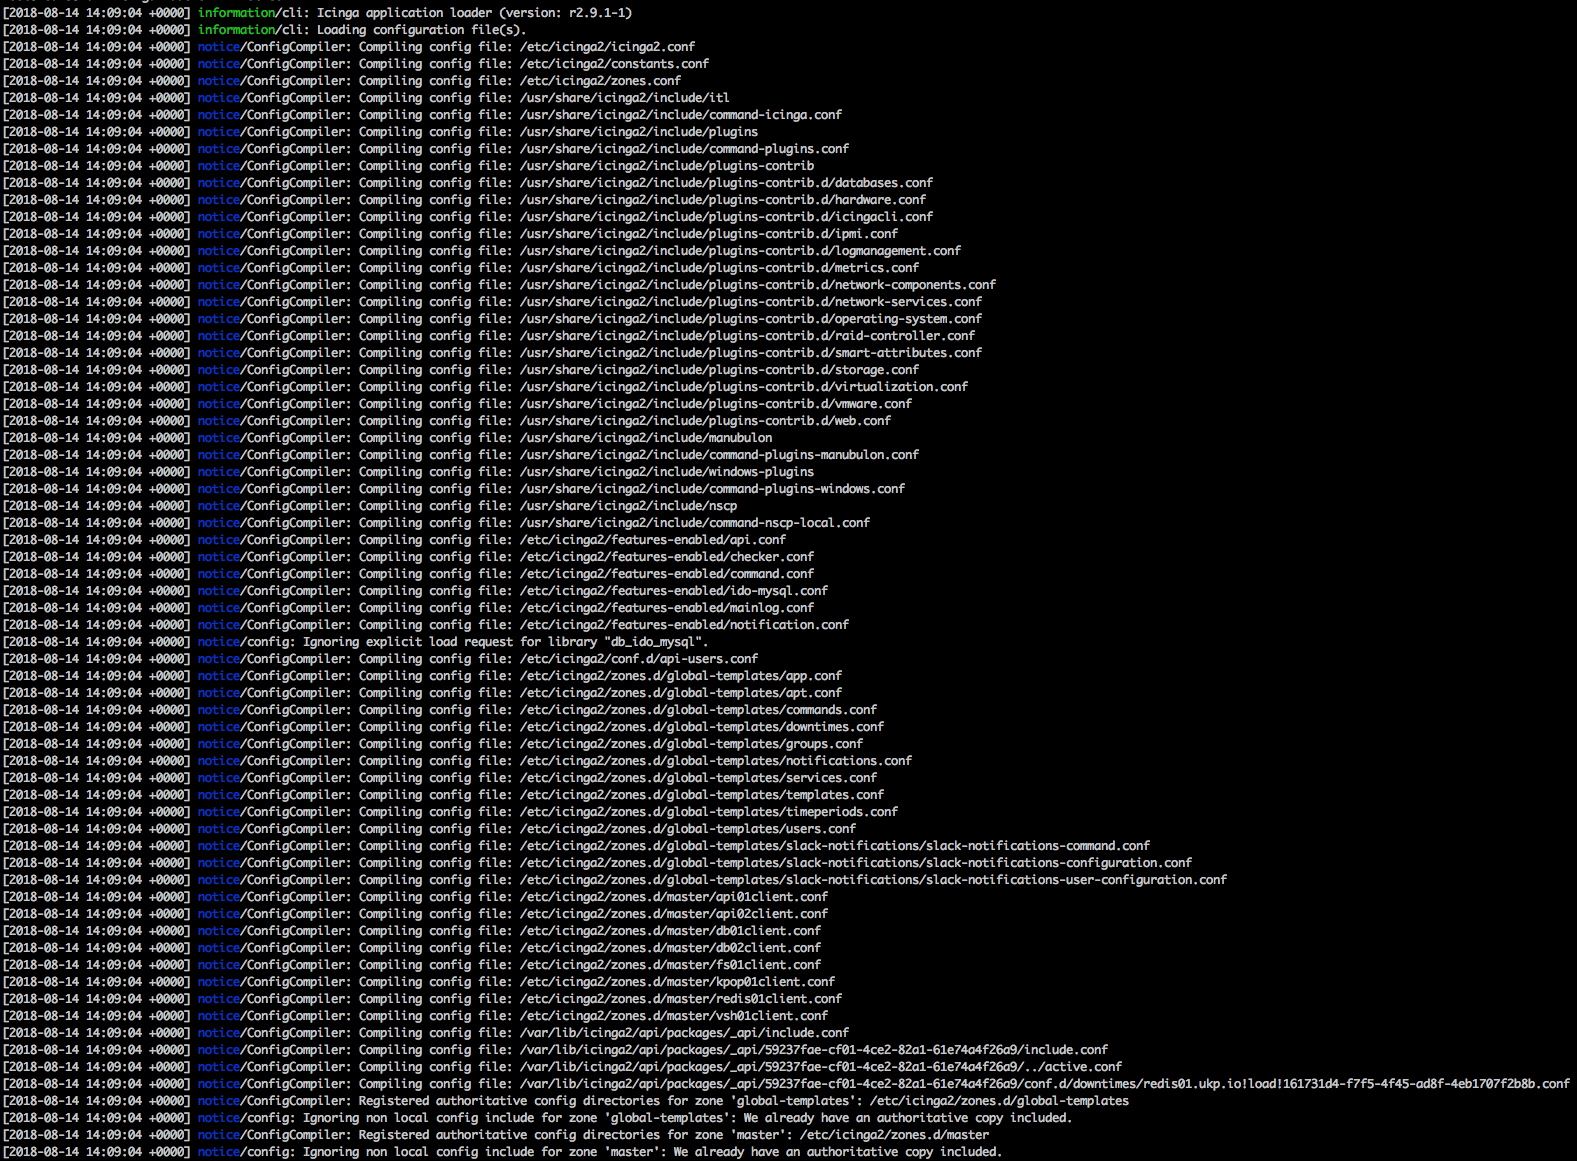
Tip: you will probably face some problems applying configs to the zones.d directory. To deal with it and debugging icinga2 provides an script to lunch the service as daemon and attach the console output to your screen.
icinga2 daemon -x notice
And you should see any new nodes that you just added in your IcingaWeb2:

You should test that notifications are going out via email to be sure, one easy way to do that is fill one of the partitions in a node, for instance if your root partition looks like this:
# df -h
Filesystem Size Used Avail Use% Mounted on
/dev/loop22 7.8G 966M 6.4G 13% /
none 492K 0 492K 0% /dev
tmpfs 63G 0 63G 0% /dev/shm
tmpfs 63G 17M 63G 1% /run
tmpfs 5.0M 0 5.0M 0% /run/lock
tmpfs 63G 0 63G 0% /sys/fs/cgroup
tmpfs 13G 0 13G 0% /run/user/0
You can fill a temp file to trigger a Disk usage alarm:
dd if=/dev/zero of=/tmp/trash count=6000 bs=1M
Once the disk usage goes above 80% you should get an email notification from your server. Make sure your Master node can send email tough, for instance with:
echo "Subject: sendmail test" | sendmail -v "[email protected]"
If you don’t get an email in a few seconds and your server is brand new, try installing mailutils:
apt install mailutils
Once you are done with your testing, remember to delete that /tmp/trash file!
Conclusion
As you can see the steps are many but the reward is grand: now you’ll know what your servers are doing all the time and get notified if you are running out of hard drive or whatever.
Remember that we have provided minimal examples for each tool configuration, you can customize it as much as you want and set it up to monitor other kinds of things too, like the update status of Drupal modules or WordPress plugins. Maybe in a later post we can give some examples of that.
Links
Icinga2: https://www.icinga.com/docs/icinga2/latest/
IcingaWeb2: https://github.com/Icinga/icingaweb2
Ganglia: https://github.com/ganglia/monitor-core/wiki/Ganglia-Quick-Start