Monitoring your servers like a Boss – Part 1: Ganglia
In today’s post we will be sharing the steps necessary to monitor your server in a reliable way.
We will install two different tools for this purpose, both of them monitor a set of metrics in your nodes (machines running the clients, meaning your servers).
Some of the monitored metrics are:
- CPU Usage
- Disk usage
- Network usage
- Number of running processes
- SWAP usage
- Others
In this first post we will talk about is Ganglia. This is another classic tool of the Unix community. It generates plotted graphs of the values of each of the monitored resources over time. It’s a great tool to see the trends in your resource usage, and it is very lightweight.
Nowadays there is a more sophisticated graphing tools like Grafana or the ELK Stack. However, in our experience, this tools require more hardware on the central server. You do get more features if you want to give them a try but we choose speed and agility 🙂
As always, the tools we will be discussing are Open Source and run on GNU/Linux. For this tutorial, we will use Ubuntu 16.04, but the steps should be similar in other Debian-based distros. RedHat-based and others may have different package names so beware!
We will also be using domain names that end in .yourdomain.com
You will need to change this to the actual domain names that resolve to your server’s IP addresses.
Ganglia
Server and WebUI
In this section we will install the gmetad daemon to collect all stats, rrdtool to generate the graphs and ganglia-webfrontend to make it web accessible.
Run the following command
apt install rrdtool gmetad ganglia-webfrontend ganglia-monitor
The next step is to configure gmetad.conf, edit the file /etc/ganglia/gmetad.conf and setup the information for the Ganglia Cluster you will be monitoring. In this example we’ll call it 42mate-cluster.
You need to edit 3 lines:
data_source 42mate-cluster 60 monitor.yourdomain.com
gridname 42mate-cluster
authority http://monitor.yourdomain.com
trusted_hosts monitor.yourdomail.com node1.yourdomain.com node2.yourdomain.com
Then we symlink the rrds directory from ganglia to ganglia-web:
ln -sf /var/lib/ganglia/rrds /var/lib/ganglia-web/rrds
Then we edit /etc/ganglia/gmond.conf indicating the information of the Cluster:
cluster {
  name = "42mate-cluster""
  owner = "42mate"
  url = http://monitor.yourdomain.com
}
Now change the udp_send_channel section to this:
udp_send_channel {
  host = monitor.yourdomain.com
  port = 8649
  ttl = 1
}
And the udp_recv_channel section to this:
udp_recv_channel {
  port = 8649
}
Lastly on this file, you want to setup the interval at which Ganglia will report metadata to the central node, in this case our WebUI server:
globals {
  /* Other configurations ... */
  send_metadata_interval = 300
}
Now you can restart the gmetad and ganglia-monitor services to start collecting those juicy metrics:
service gmetad restart
service ganglia-monitor restart
The final step required to setup the actual WebUI is this:
ln -s /etc/ganglia-webfrontend/apache.conf /etc/apache2/sites-enabled/ganglia-webfrontend.conf
service apache2 restart
After doing that you should be able to access your new and shiny Ganglia Web in http://monitor.yourdomain.com/ganglia
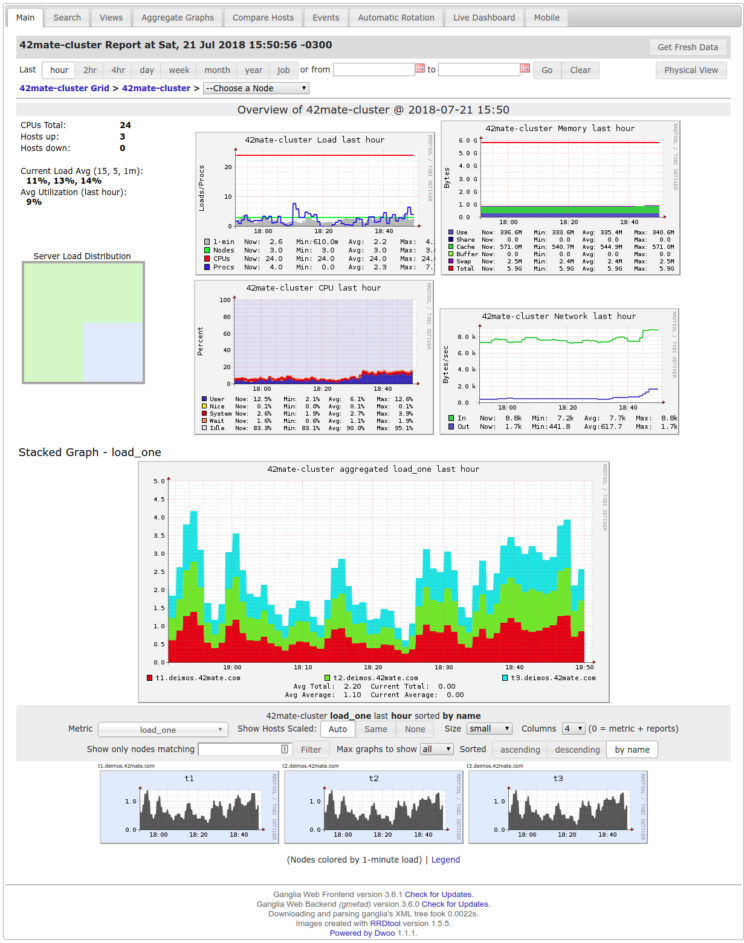
You should see after a few minutes the metrics being collected, it will look something like this:
If you are not satisfied with the port or url for your WebUI, feel free to create a new virtualhost file in /etc/apache2/sites-available/ganglia-webfrontend.conf , then symlink it to /etc/apache2/sites-enabled/ganglia-webfrontend.conf and finally restart Apache.
One important note here is that Ganglia Web does not have authorization and authentication features so it will be a good idea for you to add a Basic HTTP Auth or something more robust in front of it. That is unless you want your server metrics to be available for the whole world to see 🙂
Nodes
The setup steps for the nodes that we want to report to Ganglia Web are similar but somewhat simpler.
First step is to install the necessary packages:
apt install ganglia-monitor
Then we edit /etc/ganglia/gmond.conf indicating the information of the Cluster:
cluster {
  name = "42mate-cluster""
  owner = "42mate"
  url = http://monitor.yourdomain.com
}
Now change the udp_send_channel section to this:
udp_send_channel {
  host = monitor.yourdomain.com
  port = 8649
  ttl = 1
}
Lastly on this file, you want to setup the interval at which Ganglia will report metadata to the central node, in this case our WebUI server:
globals {
  /* Other configurations ... */
  send_metadata_interval = 300
}
After you are done with the changes, restart the ganglia-monitor service:
service ganglia-monitor restart
Now just wait a few minutes and you should start seeing all your nodes show up in your WebUI.
If after 5 minutes you don’t see information from the nodes on your WebUI, you can try restarting the gmond service in the WebUI node:
service gmetad restart
That’s is, easy as pie!
Next on the agenda
Head on to Part 2 when you are ready to give Icinga2 a try.
For now you get to see all the default metrics graphed nicely and without taking a datacenter worth of computing power in your Ganglia instance 🙂
Links
Ganglia: https://github.com/ganglia/monitor-core/wiki/Ganglia-Quick-Start


