Using Xdebug with Vagrant and PHPStorm
This is a guide about how to use Xdebug with PHPStorm if our project is running in a Vagrant machine.
The hard part of this guide is to know how to properly setup the IDE, lucky for us the people of JetBrains, as always, are doing a great job and they have a good integration with vagrant ready for us, following these steps you won’t have any problem to keep this running quickly.
Some considerations
For this guide I’m using OSX with PHP Storm 2016.2.1, I have a Vagrant Machine using VirtualBox with a Drupal site project and the vagrant machine has his own IP address. I can connect to the vagrant machine from my host machine using the network and the IP address as any machine, in other words the virtual machine is using a bridge configuration.
The site is running in the Vagrant machine and I can access using the domain local.priles.com because the host entry is in the host table of the host machine.
The Vagrant machine is running an Ubuntu and it has PHP 5.6.
I’m assuming that your project as a root folder and the Vagrant file is in the root, also that your source folder is inside of a src folder that also is located in the root of your project.
The local files are available in the Vagrant machine using NFS, and the src folder is mounted in /var/www/local.priles.com
Setup Xdebug
The first step is to install and configure xdebug. In the vagrant machine run this command to install
vagrant$ sudo apt-get install php5-xdebug
After that edit the debug configuration in the vagrant machine
vagrant$ sudo vi /etc/php/5.6/fpm/conf.d/20-xdebug.ini
Put these options in the file
zend_extension=xdebug.so
xdebug.remote_enable=1
xdebug.remote_host=0.0.0.0
xdebug.remote_connect_back=1
xdebug.remote_port=9000
This will enable debug connections from any remote machine on the port 9000.
Now restart your php-fpm process (or apache if your are using apache with mod php).
vagrant$ sudo service php5.6-fpm restart
With that you vagrant machine is ready, the next step is to setup PHPStorm
PHPStorm Setup
Open your project, once is open go to preferences and look it for interpreters under Languages and Frameworks > PHP branch.
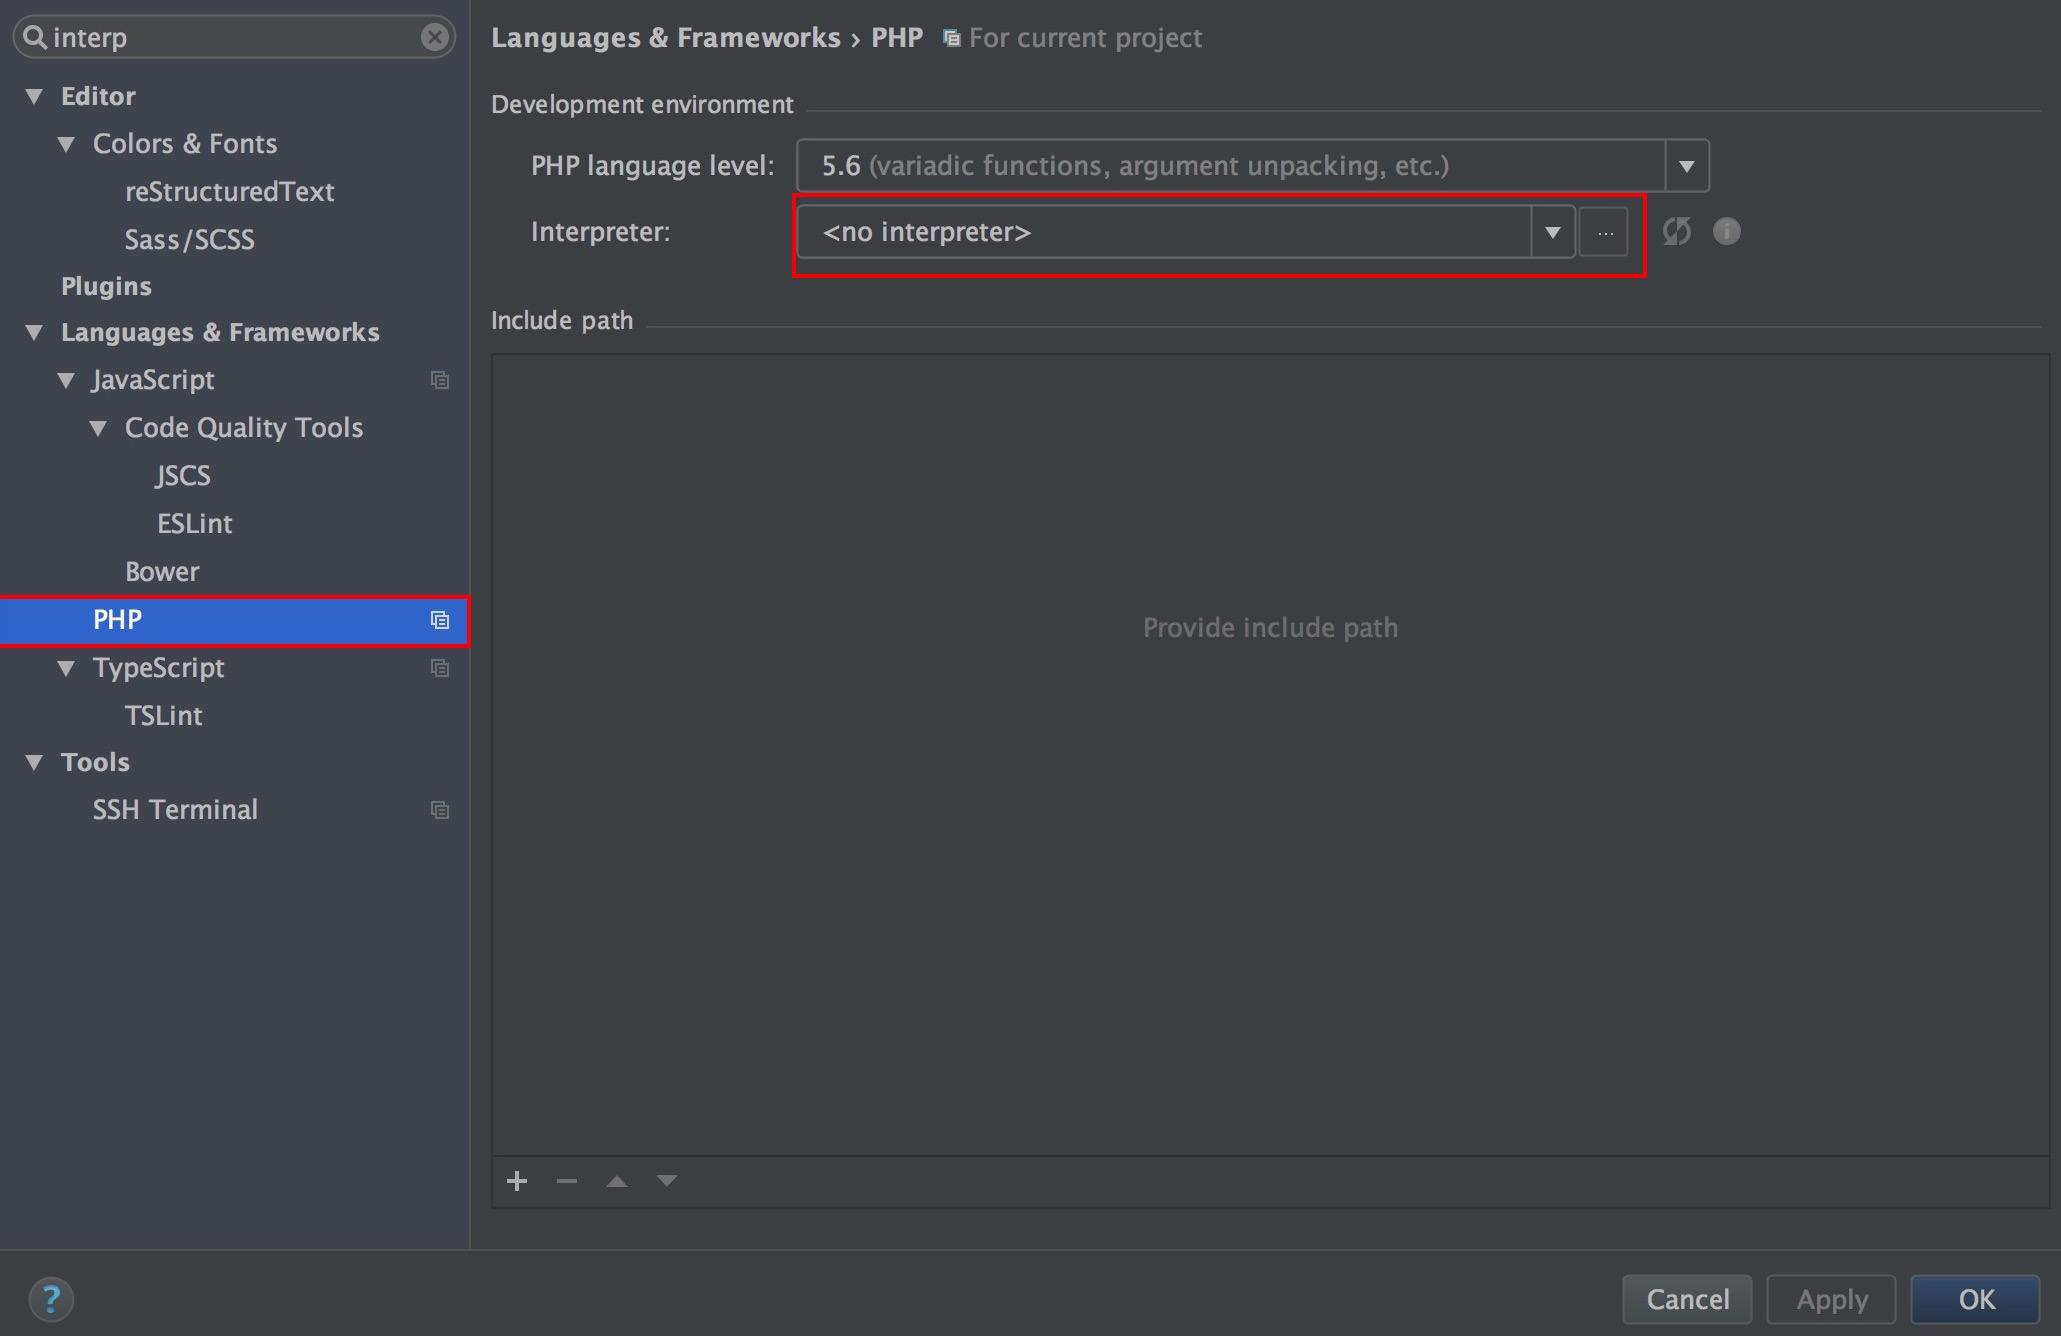
Add a new interpreter using the three dots buttons […] next to interpreter, that will open a new option window.
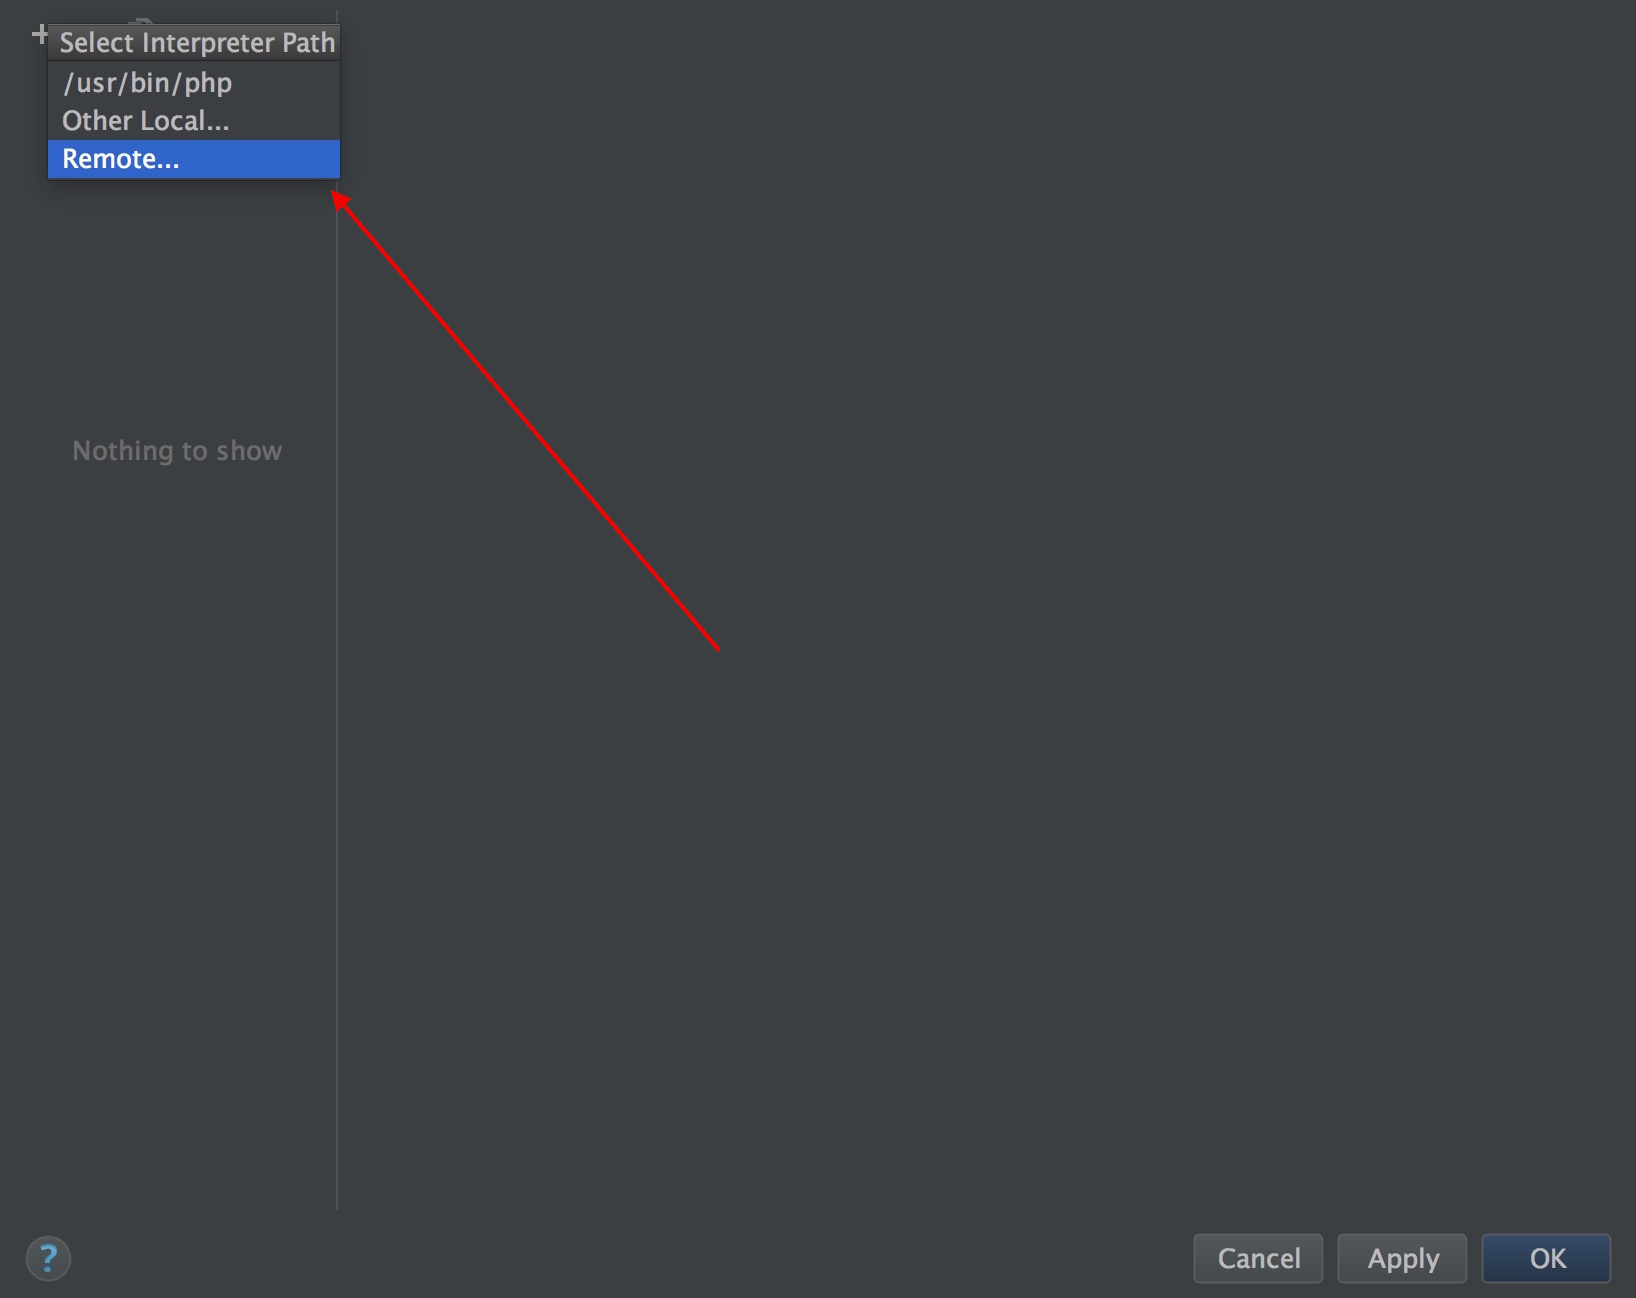
In the top of the new window there is a button with a plus sing to add new interpreters, go and hit that button and select Remote from the list of options
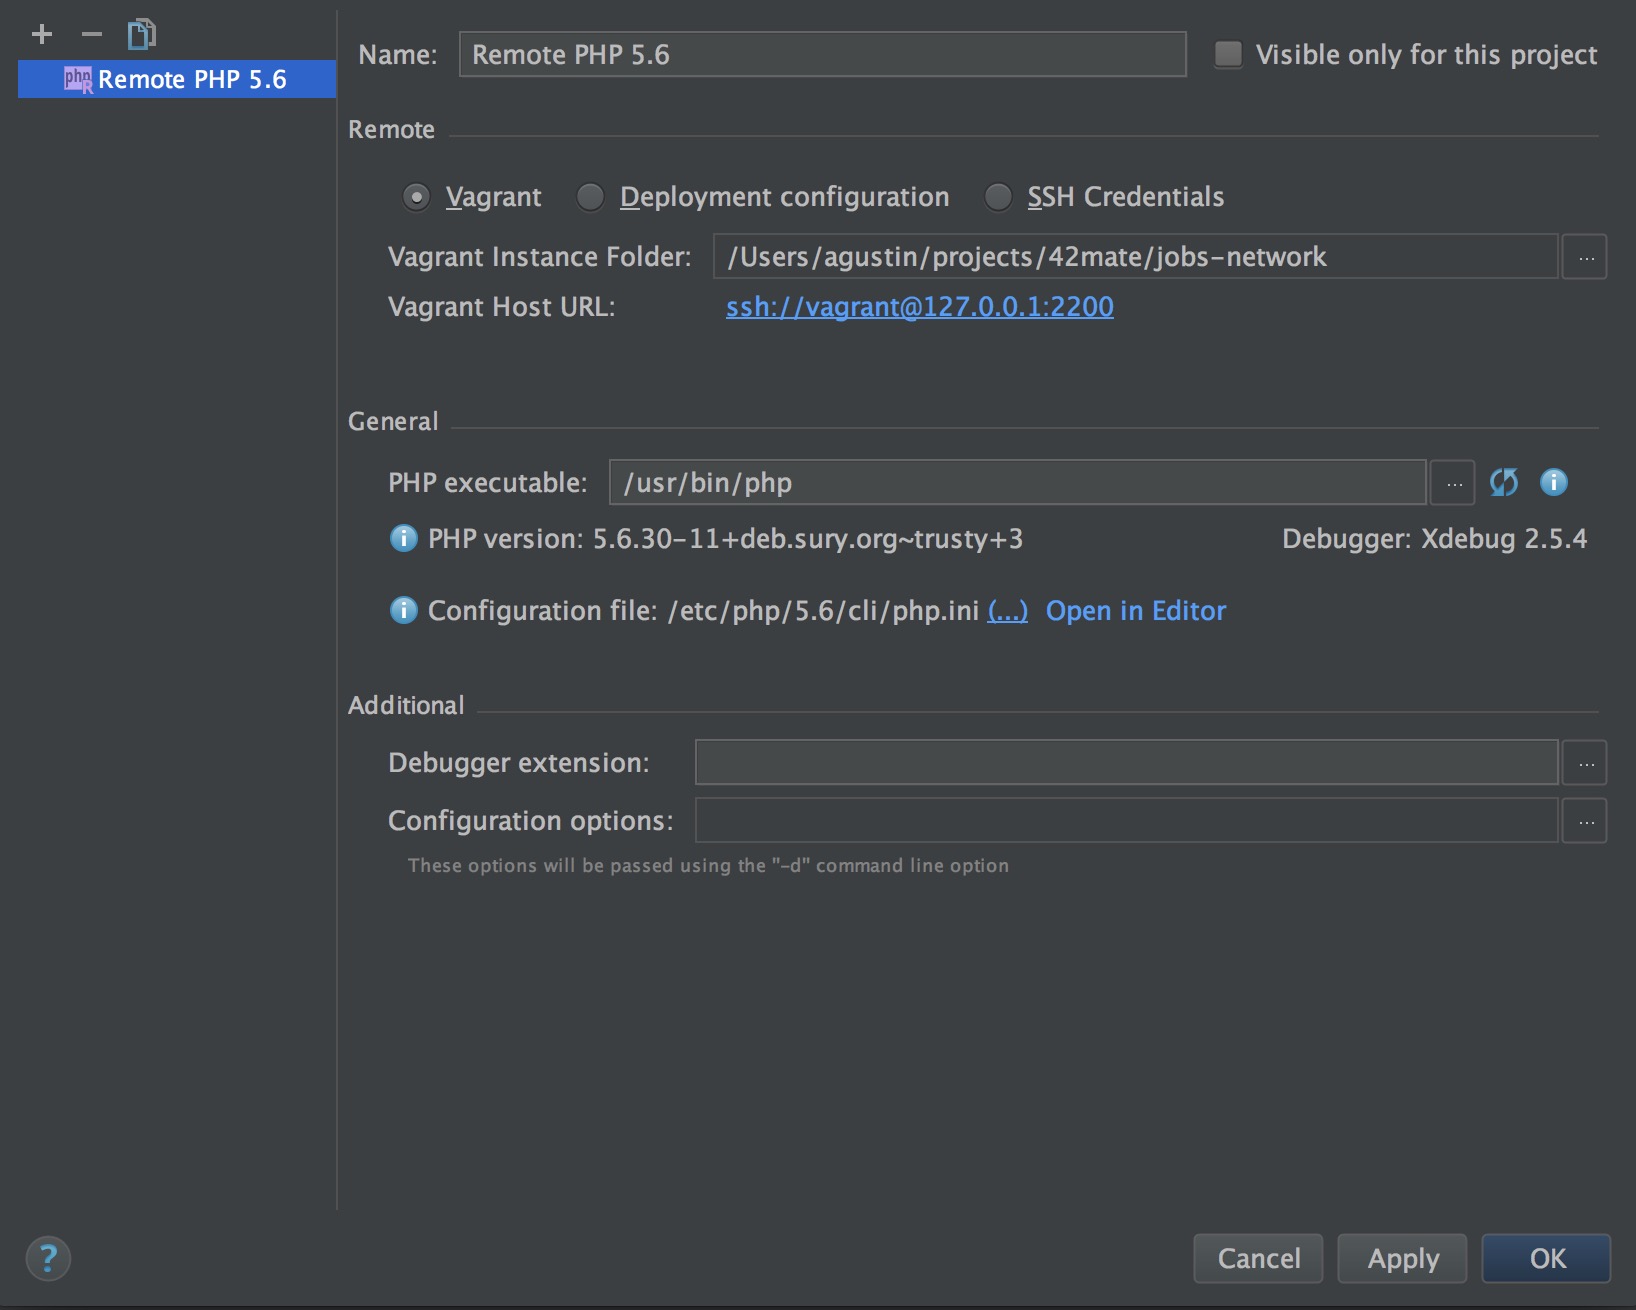
A new window will be open and there you must select Vagrant option. there you have to select the directory where is your vagrant file (the root of the project).
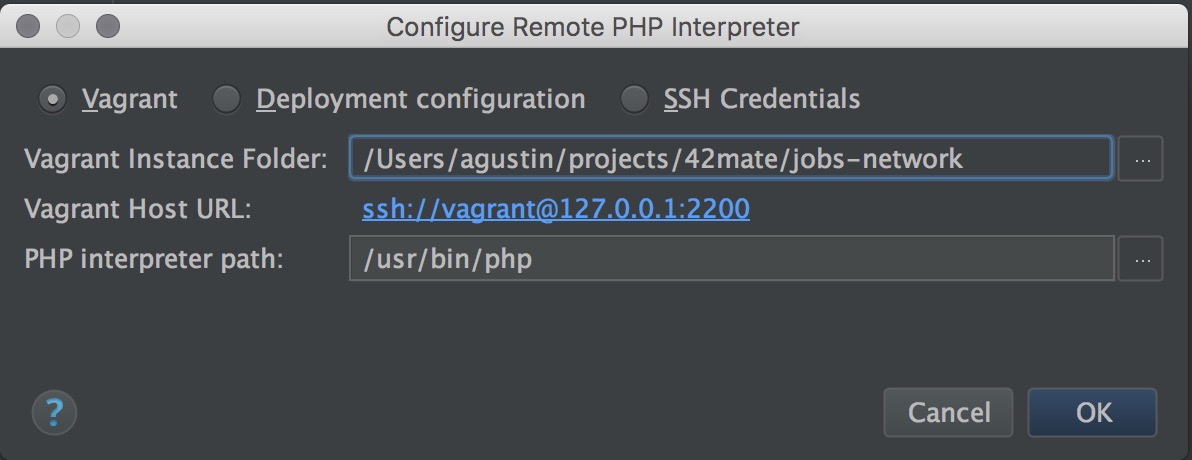
The IDE will automatically detect your vagrant options, will login into the vagrant using the vagrant ssh method and will discover your Vagrant machine options. If all is good will allow you to click into the Ok button, otherwise will show you the error that is probably related to your vagrant machine.
Hit Ok and you will see that now you have a new interpreter
Hit ok again and we are done here.
The next step is configure the server execution environment, Goto Run > Edit Configurations.
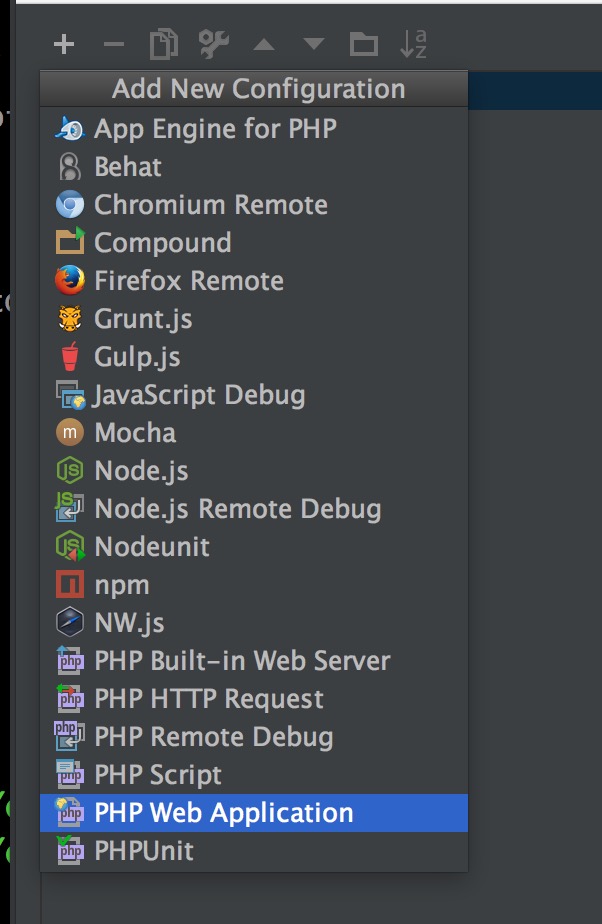
Again in the top there is a button with a Plus Sing, Click and some options will be shown, Select “PHP Web Application”.
A new window will be open and there you have to put all the information related to the vagrant web Server.
The window empty looks like that
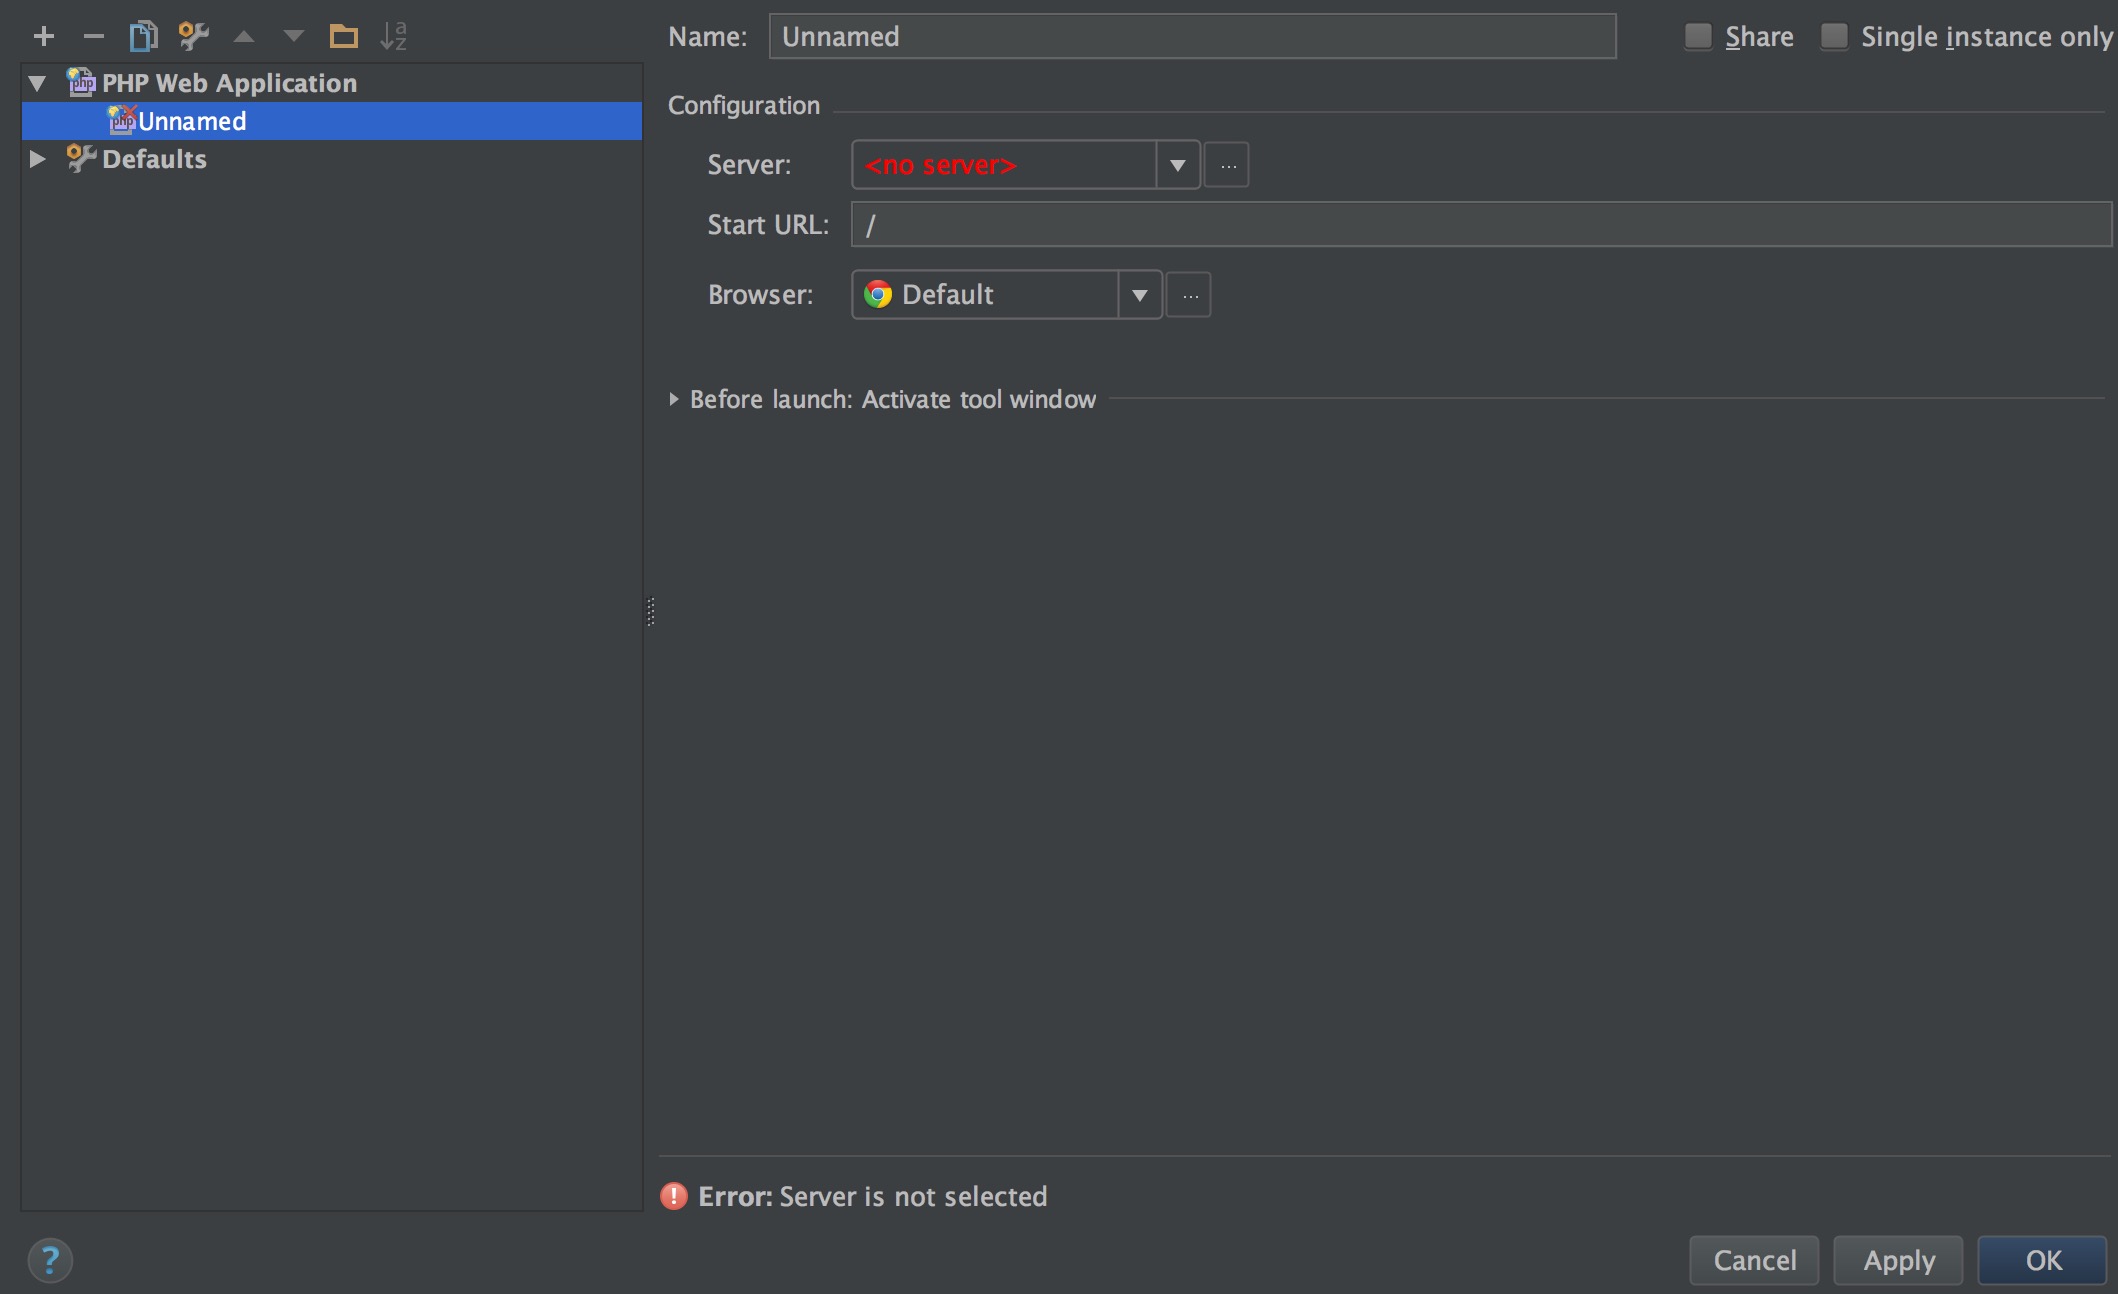
Set a name to identify the server, I use the same than the domain.
Second add the server using the […] and fill the new window options
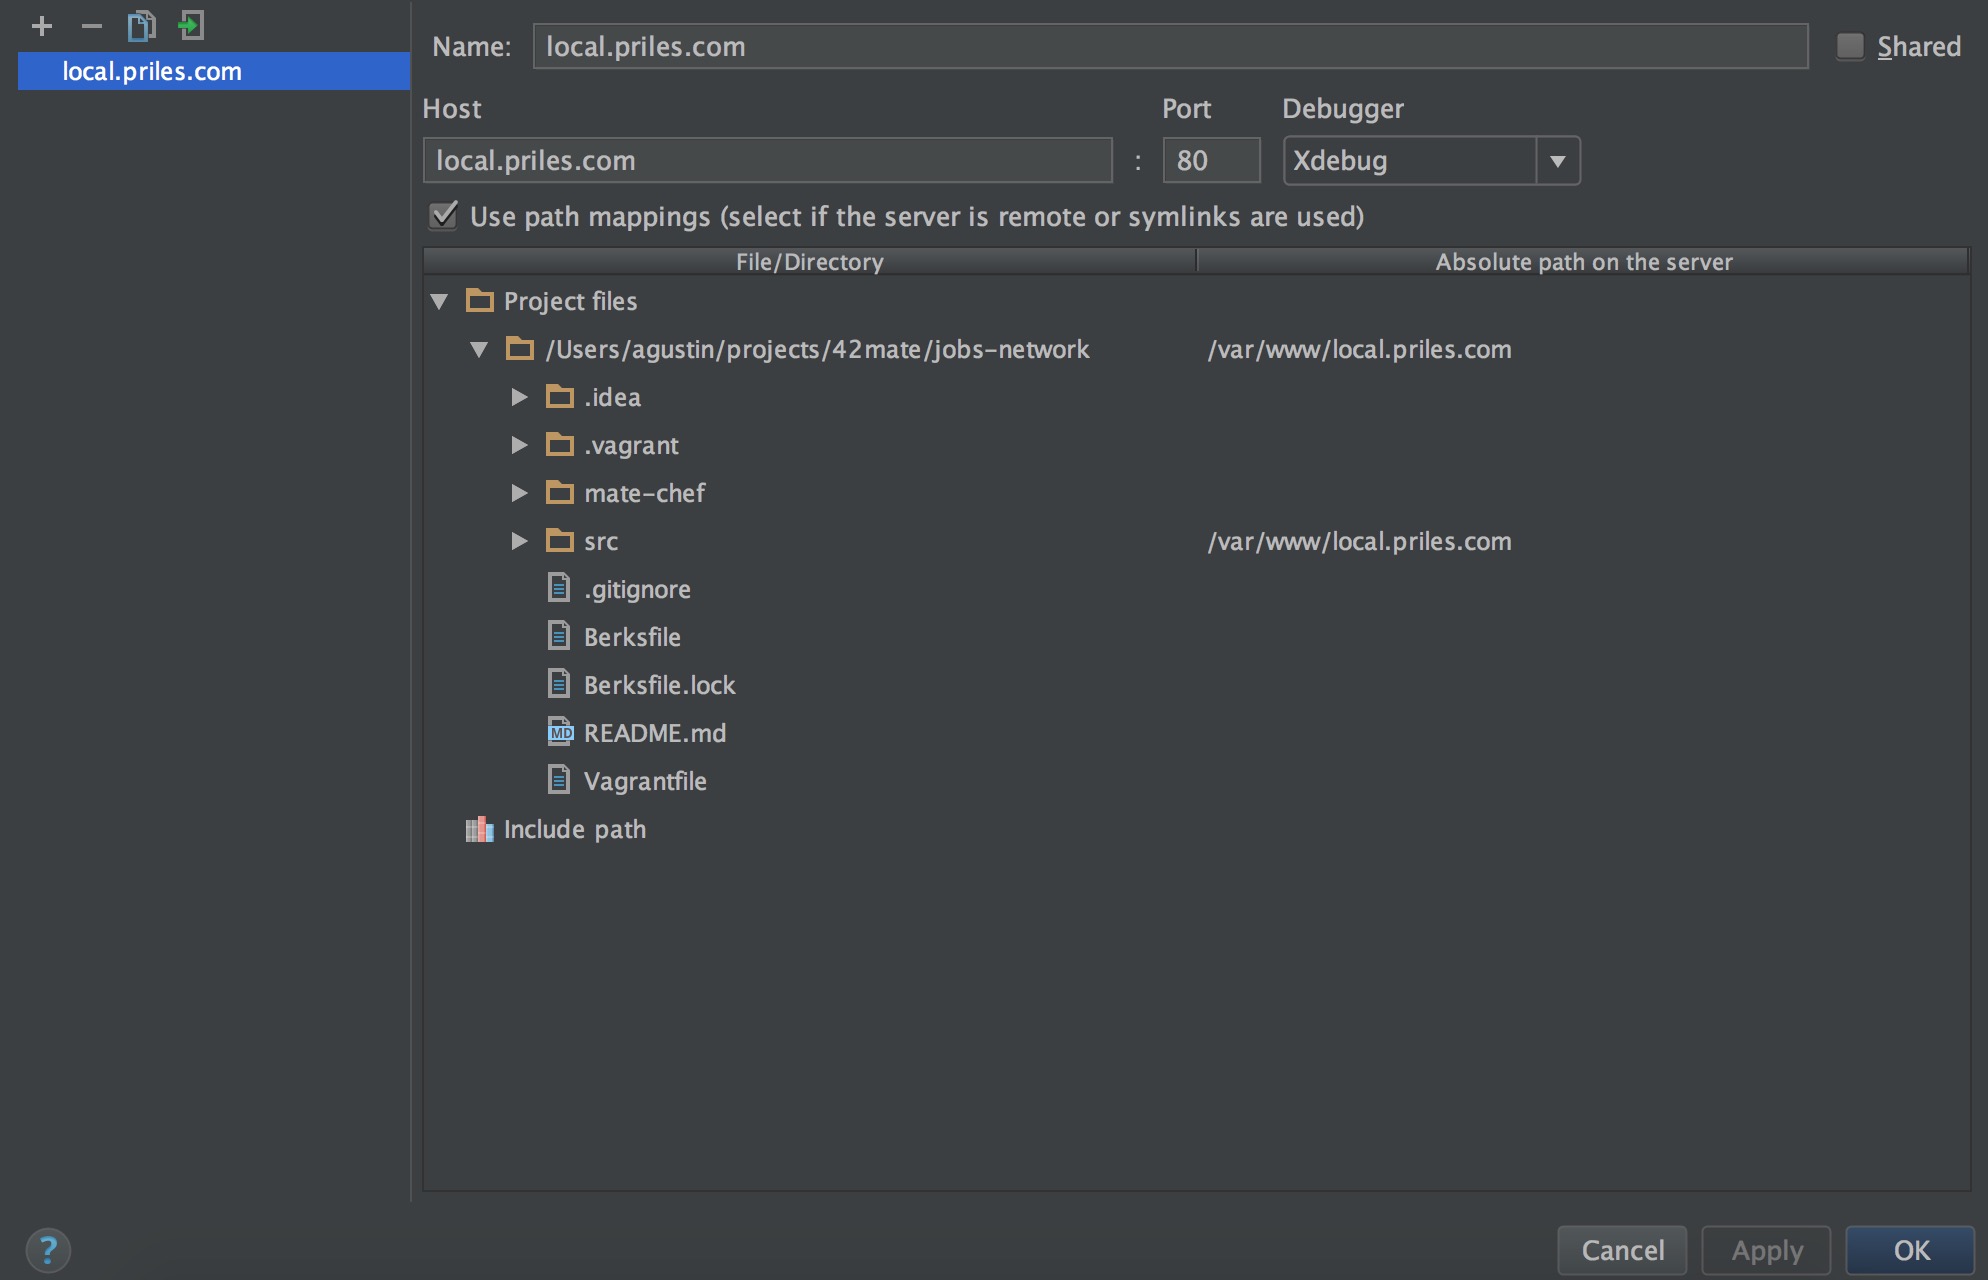
Set the name, the host, the web server port, the debugger that we will use (xdebug), And the most important, set the path mapping, this maps the path in the remote server against the files in your local machine.
As I said before, In this case the src folder in my local project is mounted in the remote server with NFS into the /var/www/local.priles.com that is also the Directory Root if the Web Server running in the Virtual Machine.
You need to be sure to match this paths properly to make the debugger works as is expected and load the proper files when are needed.
Once is done click Ok and select this server in the list of servers.
Continuing with the previous form, set the Start URL (in this case /) and the browser to open the url.
That is it, you just need to run the debug.
Start Debugging
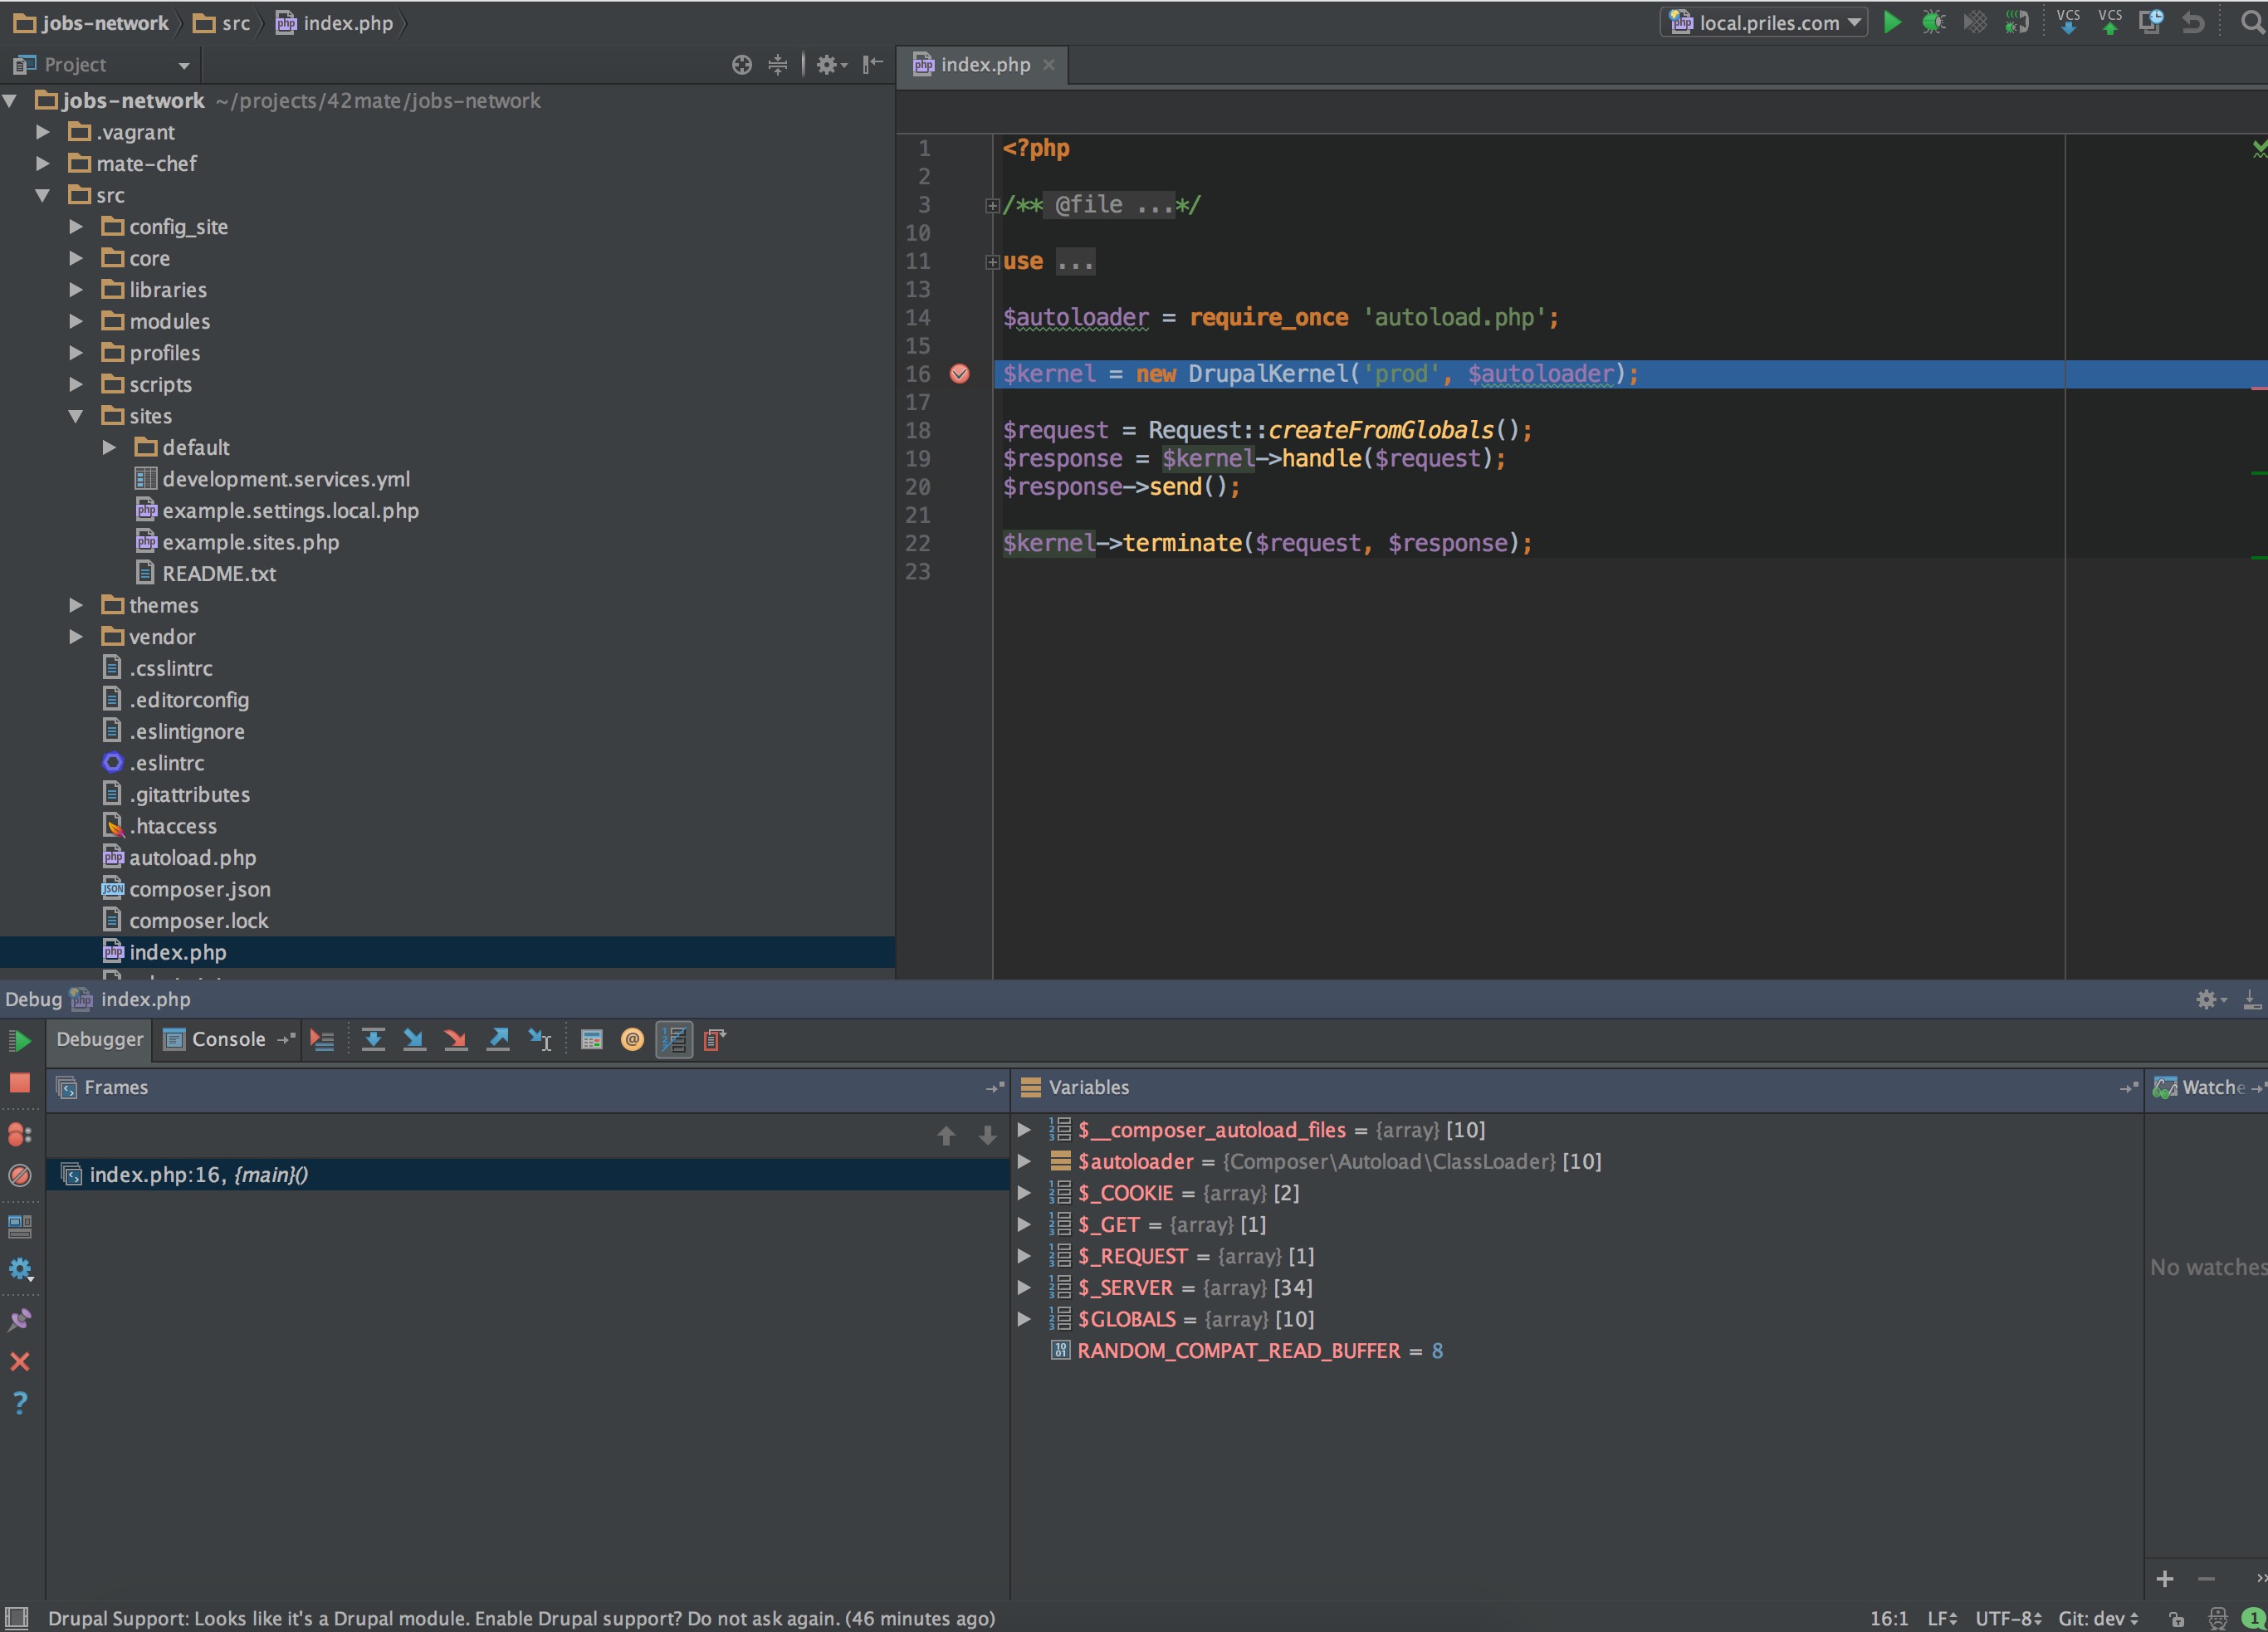
Once all the setup is done you can start debugging, in the toolbar there is a section where you’ll see the server that you have added and next to it a play button and a button with a bug.
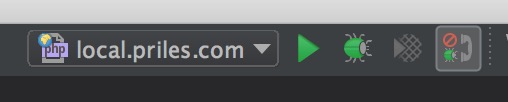
If you hit play you can launch the application without debugging, if you hit the bug button that will launch the application in debug mode, however, before that you need to put the IDE to listen PHP connections, for that there is a third button with a small bug and something that looks like a phone, by default is in red but if you click it will turn green and that means that the IDE will allow Xdebug connections. 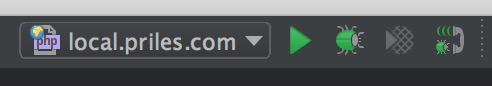
Once is activated you can hit the bug button and start debugging, put breakpoints, inspect variables and all the fancy things, in the bottom there is a tab to control the debug execution and inspect.
That’s all now is time to start debugging.