
Install XHProf and Tideways on Lando to use it with Drupal 9
In this article, we will describe how to install XHProf using the Tideways XHProf Extension that supports PHP +8
When to use a Profiler?
Sometimes you need to improve the performance in your site or maybe you think there is something suspicious in the time that takes load the site or a specific section of your site. One of the best things to use on those situations is to use a profiler tool.
A profiler is a tool that helps you analyze which portions of your system are executed most frequently or where most of the time is spent.
In this article, we will describe how to install XHProf using the Tideways XHProf Extension that supports PHP +8 (“the ocho”).
Setup
1. From your terminal, install the xhprof contrib module.
composer require 'drupal/xhprof:^1.0@beta'2. On your .lando.yml file, add the following under the appserver service section:
services:
  appserver:

    # ...

    build_as_root:
      - echo "Install Tideways ..."
      - cd /tmp && git clone https://github.com/tideways/php-profiler-extension.git
      - cd /tmp/php-profiler-extension && phpize && ./configure && make && make install
      - echo 'extension=tideways_xhprof.so' > /usr/local/etc/php/conf.d/tideways_xhprof.ini
      - chown www-data:www-data /usr/local/etc/php/conf.d/tideways_xhprof.ini
3. Since this is being installed in an ongoing project run:
lando restart -y4. On your browser, use you admin menu and go to Extend to install this module as usual.
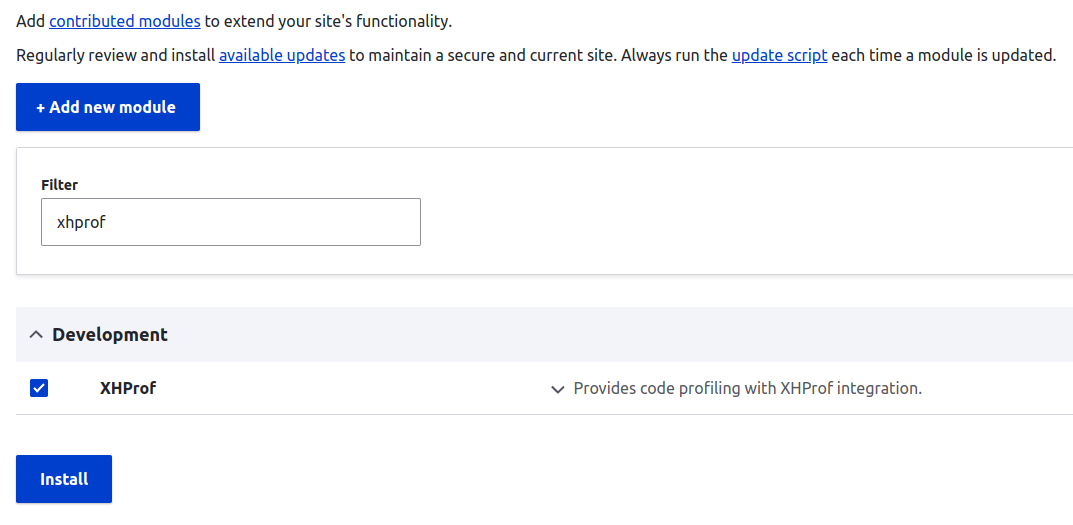
If you want to drush to install it, that is also fine.
5. On your admin menu, go to Configuration > Development > XHProf, to enable profiling in page views of your site.
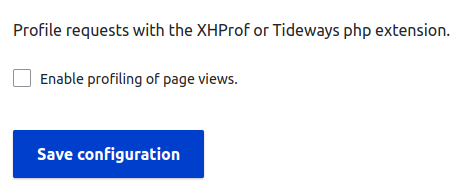
Note: If that checkbox is disabled, it will mean that tideways isn’t properly installed.
Otherwise, once you check that option you should see something like this:
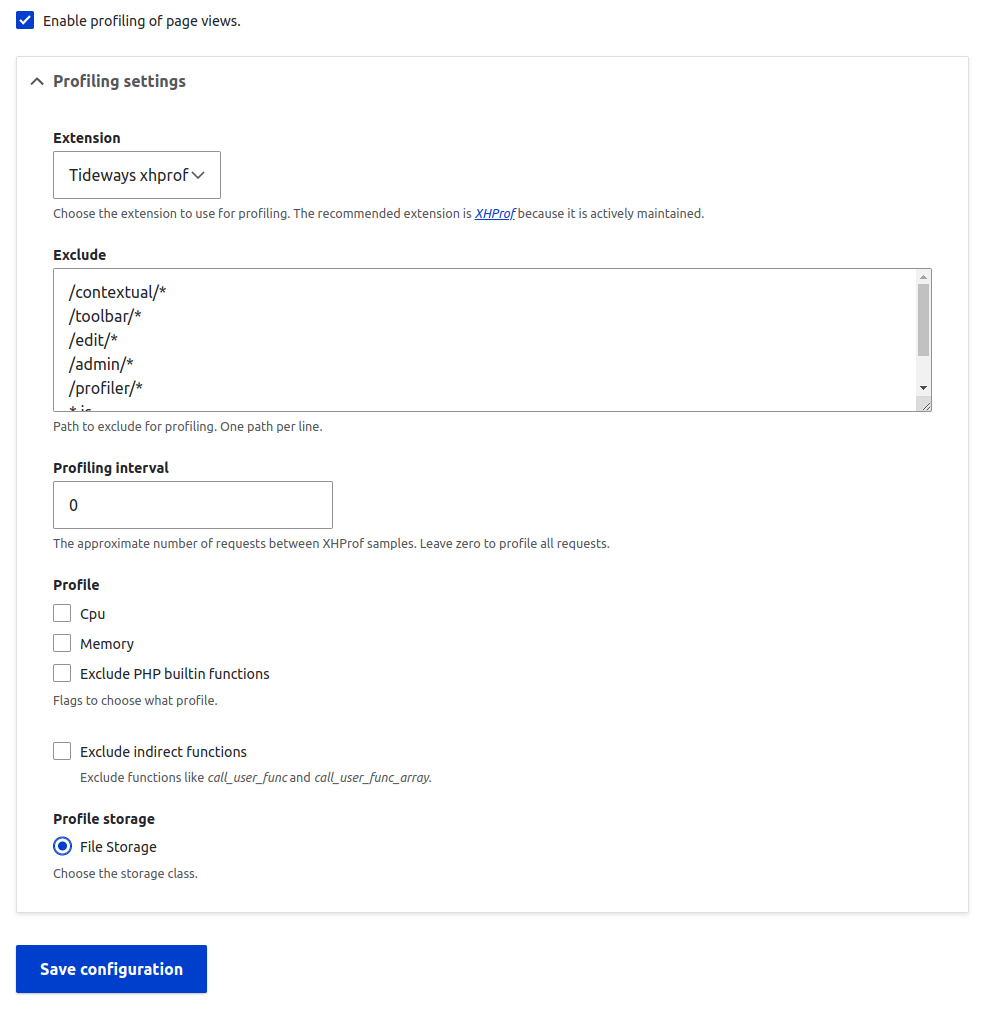
Feel free to change any option and when you are done, save the configuration.
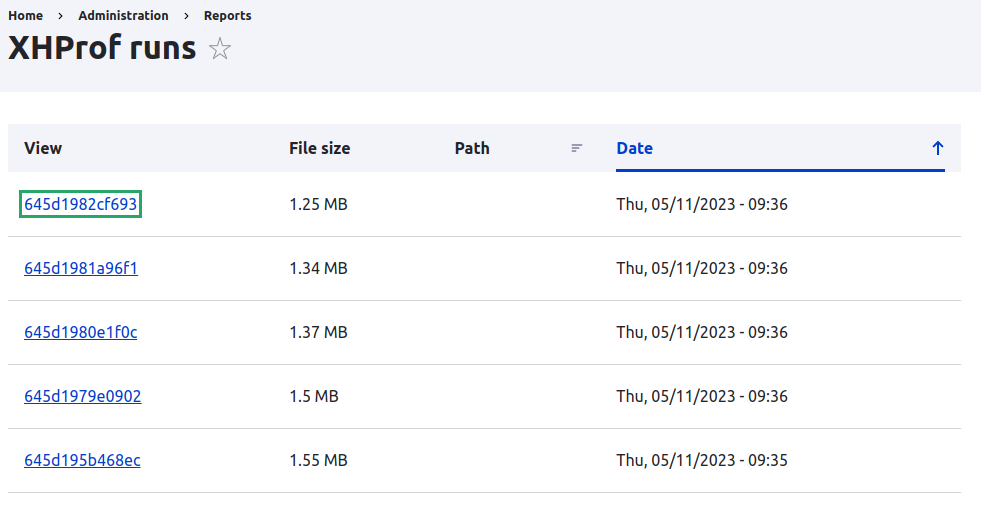
6. Now you are ready to run your tests with the new profiler. To see the list of reports, go to Reports > XHProf and you should see a list like this one:
If you are new about Profiling you will need to understand some terminology that is involved:
- Inclusive Time (or Subtree Time): Includes time spent in the function as well as in descendant functions called from a given function.
- Exclusive Time/Self Time: Measures time spent in the function itself. Does not include time in descendant functions.
- Wall Time: Elapsed time or wall clock time.
- CPU Time: CPU time in user space + CPU time in kernel space
- Calls: Number of times a function/method is called.