Hard time debugging?, not anymore with PsySH
When we have a weird bug in our app and we already have added var_dumps and dies everywhere in our code and the yet we are kind a screwed. At this time in Xdebug and setup our fancy IDE to start a step by step debugging, that usually helps, but it to cross over the exact line to find the issue; if that doesn’t work we will be in a huge problem since there is no more much to do; .
PsySH is a Read-Eval-Print Loop (or REPL). You may have used a REPL before via your browser’s javascript console. If you have, you know that it possesses a lot of power and can be useful while debugging your JS code.
Talking about PHP, you might have used PHP’s interactive console (php -a) before. There you can write some code and the console will execute it as soon as you press enter. PsysH is like that but much better !, is like sh and zsh !.
You can find a lot of tips and tricks about how to use it in the internet, I also saw that some frameworks like Drupal and Laravel are including PsySH into their solutions, pretty cool huh ?.
In this post I want to show you how to use it to debug any PHP application, for that I’ll assume that you are using Composer and PSR-0 in your app, if not include PsySH libraries in your App (I’m not going to do that for you since you are so cool to not use PSR-0).
First step, include the requirement in you composer.js, add this line to your require branch.
"psy/psysh": "dev-master"
Then you’ll have to update your composer, keep in mind that this is a dev package, you might have to use –dev (be careful if you are doing this in a ongoing project, it might break it).
Once the update is done you’ll have PsySH libraries in your vendor folder and ready to be used in your project.
In order to add the interactive breakpoints you’ll have to run in a console the php embedded server in order to prompt PsySH in the console where you have started the php web server.
To run the php webserver, go to your project docroot and run
$ php -S 127.0.0.1:8080
PHP 5.4.35-0+deb7u2 Development Server started at Wed Jan 28 18:51:35 2015
Listening on http://127.0.0.1:80
Document root is /var/www/towel/web
Press Ctrl-C to quit.
The final step is to add a code line in the place where you want to stop and start the interactive commands.
     public function index($request)
    {
        \Psy\Shell::debug(get_defined_vars());
        //Some code here maybe
        return $this->twig()->render('index.twig');
    }
So, now you have to go to your browser, go to http://127.0.0.1:8080 and be sure that your url goes over your function where you have placed the breakpoint
\Psy\Shell::debug(get_defined_vars());
And Bam!, the prompt of PsySH will be in the console where you have running the php webserver
PHP 5.4.35-0+deb7u2 Development Server started at Wed Jan 28 18:56:54 2015
Listening on http://127.0.0.1:80
Document root is /var/www/towel/web
Press Ctrl-C to quit.
Psy Shell v0.3.3 (PHP 5.4.35-0+deb7u2 — cli-server) by Justin Hileman
Now write some commands, like help
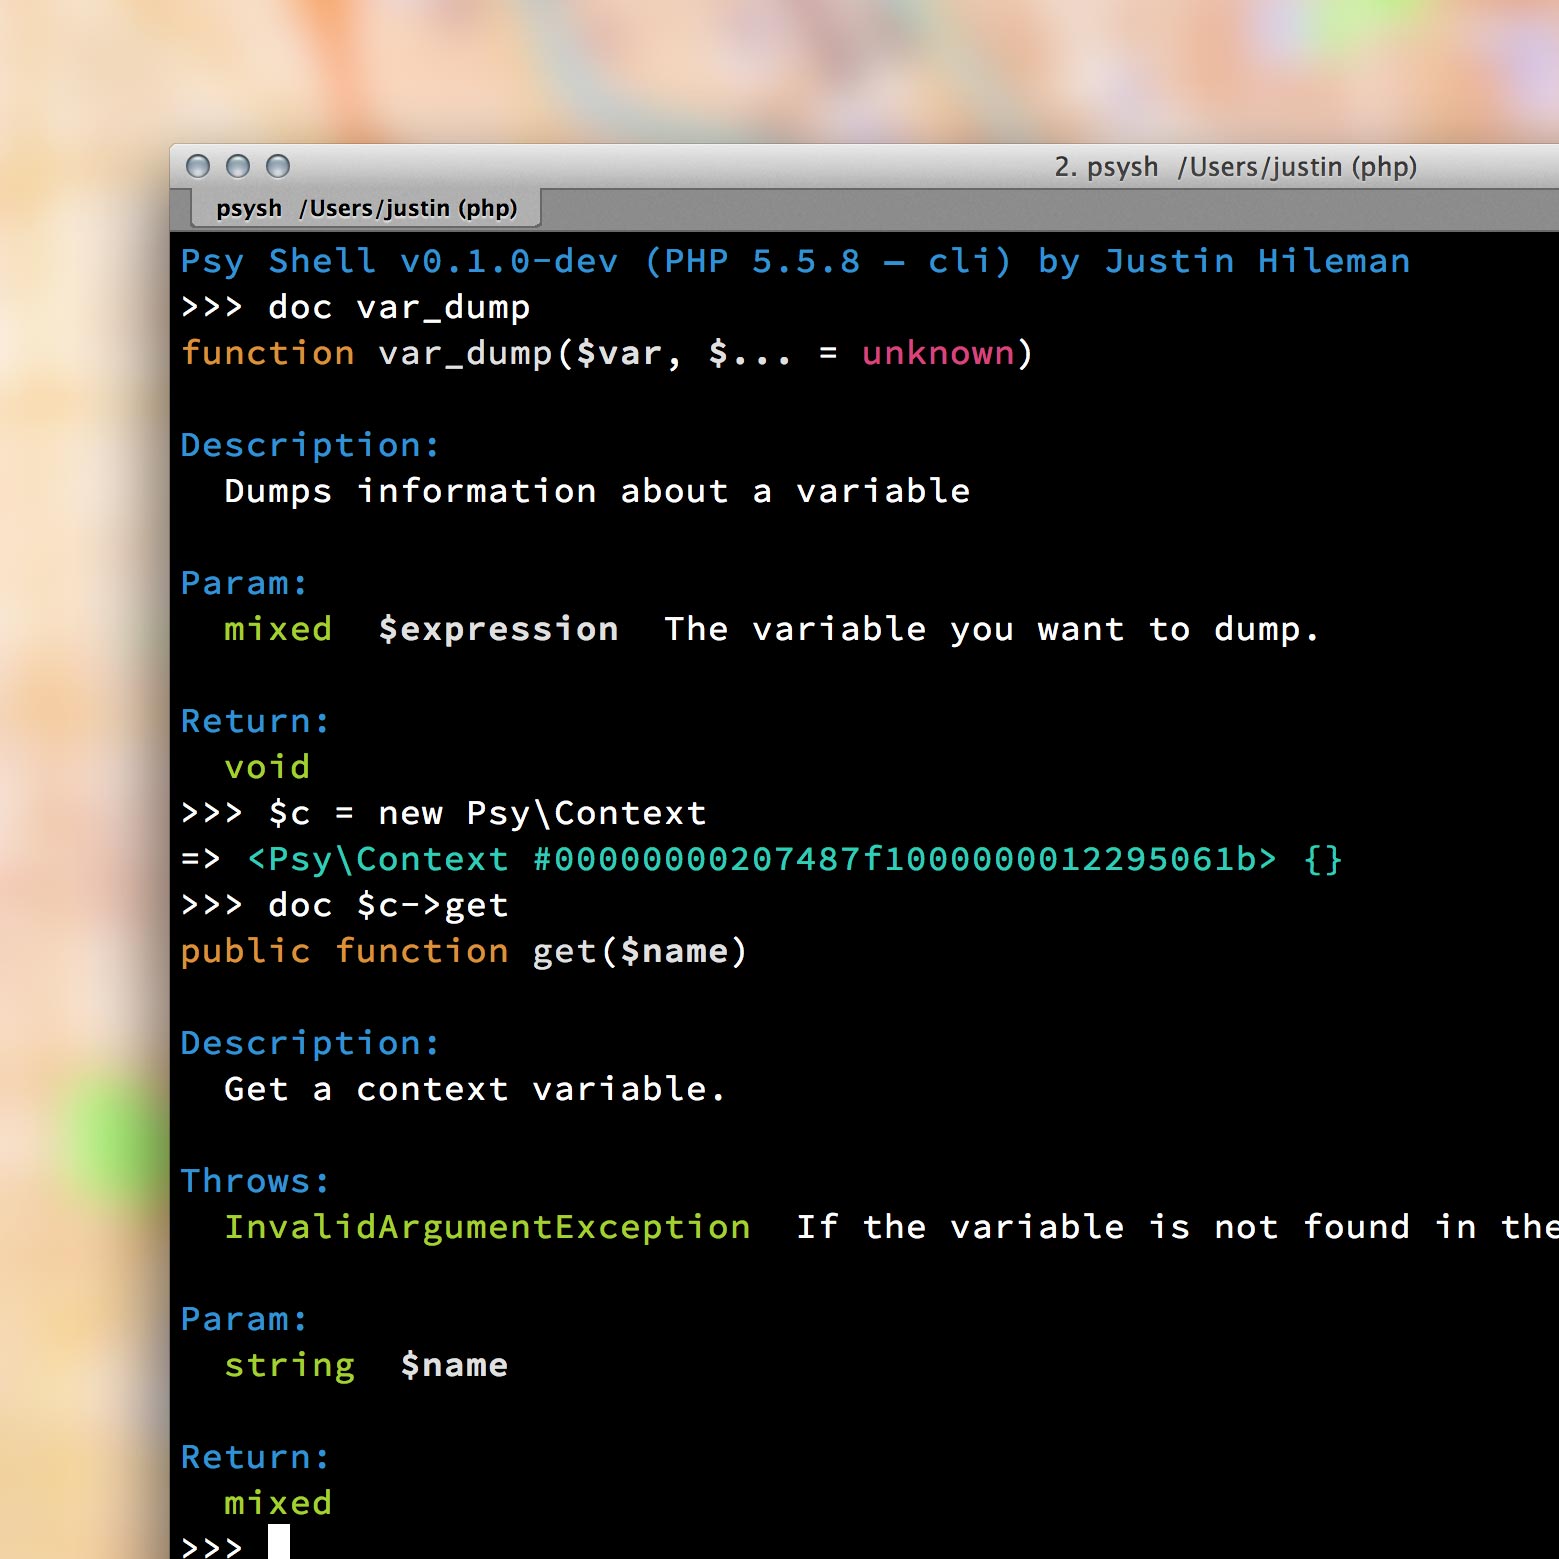
help
  help Show a list of commands. Type `help [foo]` for information about [foo].
  ls List local, instance or class variables, methods and constants.
  dump Dump an object or primitive.
  doc Read the documentation for an object, class, constant, method or property.
  show Show the code for an object, class, constant, method or property.
  wtf Show the backtrace of the most recent exception.
  whereami Show where you are in the code.
  trace Show the current call stack.
  buffer Show (or clear) the contents of the code input buffer.
  history Show the Psy Shell history. Aliases: hist
  exit End the current session and return to caller. Aliases: quit, q
Check where is your breakpoint
whereami
7|   /**
8|    * Post Index
9|    */
10|   public function index($request)
11|   {
12|     \Psy\Shell::debug(get_defined_vars());
13|     $s = $this->twig()->render('Post\index.twig');
14|     return $s;
15|   }
Explore a variable
show $request
31| class Request
32| {
33|   const HEADER_CLIENT_IP = 'client_ip';
34|   const HEADER_CLIENT_HOST = 'client_host';
35|   const HEADER_CLIENT_PROTO = 'client_proto';
36|   const HEADER_CLIENT_PORT = 'client_port';
37|
38|   const METHOD_HEAD = 'HEAD';
39|   const METHOD_GET = 'GET';
40|   const METHOD_POST = 'POST';
.... this continues.
into the runtime, in the specific stack, in that exact state of your code, so you can show the variables to verify their value, change their values add more interactive lines of code, that will affect the state of the current execution so is easy to test, analyze, review, probe concepts and more.
Conclusion
As you can see, the power of this tool is huge, some light in moments of darkness. I recommend you to , you might need it some day.
If you want to learn more, this posts were very enlightening for me
http://www.sitepoint.com/interactive-php-debugging-psysh/
https://presentate.com/bobthecow/talks/php-for-pirates#slide-63
And this is official site