Enhanced Varnish Dashboard, A Web Dashboard tool to manage Varnish Cache
Yesterday I saw this twit from François Zaninotto
varnish-dashboard: Advanced realtime #Varnish dashboard, supports multiple servers and advanced management tasks https://t.co/A6BcSCgm5p #JS
— François Zaninotto (@francoisz) March 11, 2015
And when I saw the tool I said, wow, this is awesome.
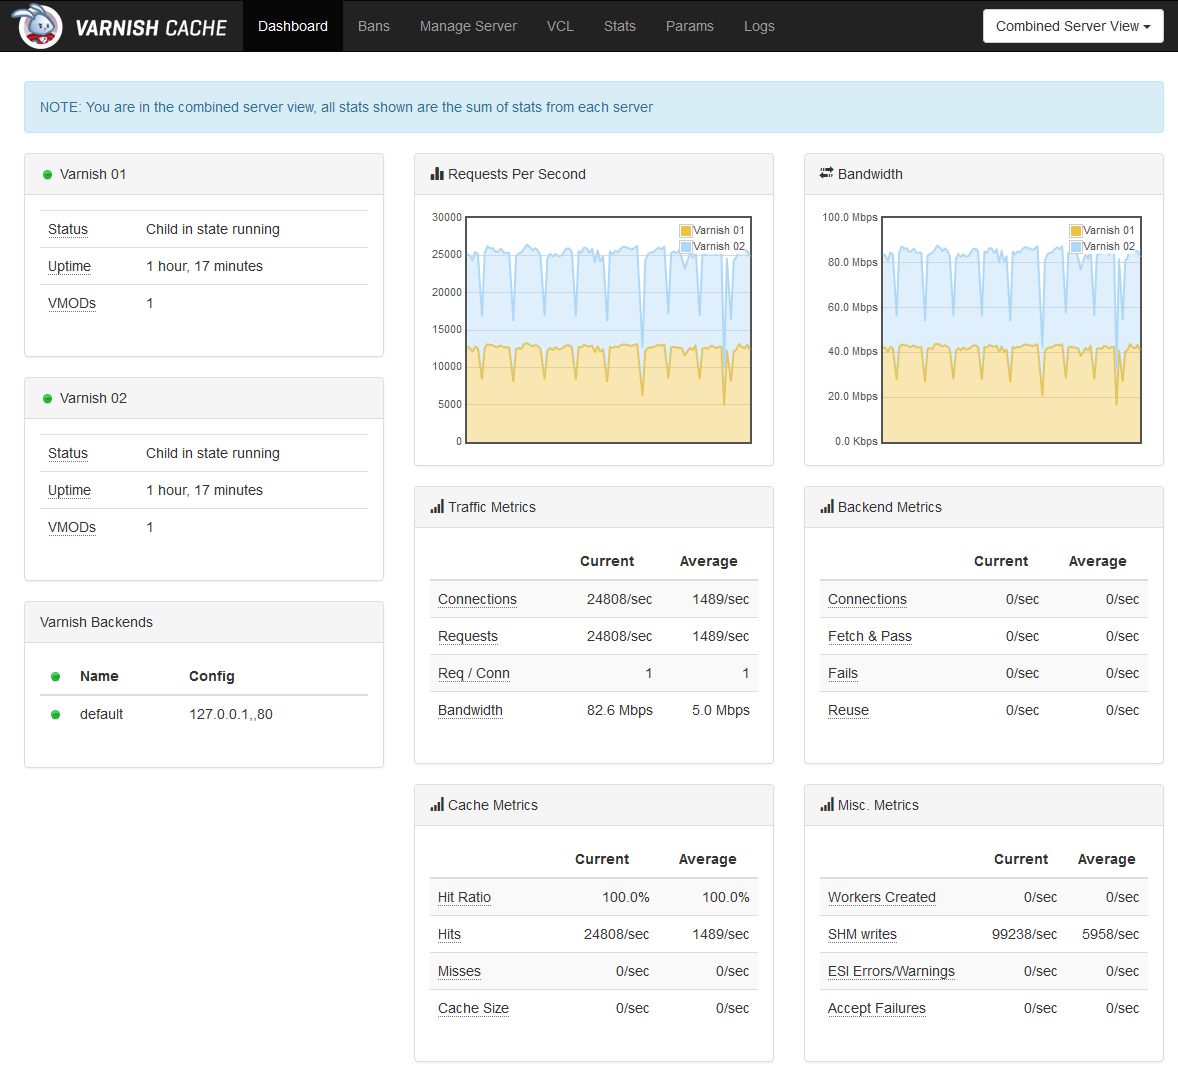
Enhanced Varnish Dashboard is a realtime HTML dashboard designed to utilize Varnish Agent 2. This dashboard is simple to install and features a stats dashboard suitable for a NOC, as well as controls for viewing logs, stats, VCL, and managing the varnish server (restart, update VCL, purge URLs, etc).
Enhanced Varnish Dashboard also has support for multiple varnish servers, and allows users to view a combined view (useful if you have multiple duplicate varnish servers for redundancy), as well as individual views.
The dashboard is just a frontend tool, the magic is in Varnish Agent 2, varnish-agent is a small daemon meant to communicate with Varnish and other varnish-related services to allow remote control and monitoring of Varnish. It listens to port 6085 by default.
This guide will explain the installation since this packages are relative new and are not ready for a quick apt-get install yet, you have to build it manually. This guide is for debian distros.
Installing dependencies
First we install all the required packages to build the agent.
apt-get install libvarnishapi-dev libvarnishapi1 libmicrohttpd-dbg libmicrohttpd-dev libmicrohttpd10 libcurl3 libcurl3-dbg libcurl4-openssl-dev python-docutils varnish build-essential automake
Installing Varnish Agent
We get the latest release of the agent and compile it in our home directory. If the compilation goes well we will do a make install to install the generated binary.
cd ~
mkdir varnish-agent
cd varnish-agent/
wget https://github.com/varnish/vagent2/archive/3.0.0.tar.gz
tar zxvf 3.0.0.tar.gz
cd vagent2-3.0.0/
bash autogen.sh
./configure
make
make install
Note : check for errors in autogen, configure, make and make install. If you have errors there you have to fix them to move forward.
At the time that I wrote this article the latest release was 3.0.0, check for new versions (https://github.com/varnish/vagent2/releases)
Edit agent secret
The agent requires a file with an user name and password, this file must be created and edited in /etc/varnish/agent_secret
vi /etc/varnish/agent_secret
Add user:password information in this file, that user will be required in the login form of the agent.
Edit your varnish vcl
The Backend Requests is a list of all the URL fetched from the backend. For this to work you need to add the following instruction to the vcl_recv routine:
set req.http.X-Full-Uri = req.http.host + req.url;
Installation of Varnish Dashboard
Now we will install the dashboard, there is several dashboard out there, this seems to me the best dashboard so far but feel free
to look for others dashboards.
Github repo of the dashboard https://github.com/brandonwamboldt/varnish-dashboard
Steps:
cd /var/www/
mkdir varnish-dashboard
git clone git://github.com/brandonwamboldt/varnish-dashboard.git
cd varnish-dashboard/
cp config.example.js config.js
vi config.js
Edit the config.js file, set the user and pass for the user agent.
Launch the agent and access to the dashboard.
varnish-agent -H /var/www/varnish-dashboard/varnish-dashboard/
Access with your browser to
http://host.name.or.ip:6085/html/
Don’t forget the trailing slash after html, otherwise you’ll see “Failed”.
Now you can start to explore the tool, so far I have some things that for me are very helpful like a real time monitor, with graphs, about what is going on, ban pages from cache easily and review/edit vcls from the web. That is super cool !
Hope this guide works for you, leave some comments if you have problems.
Here I leave some links that help me
https://github.com/varnish/vagent2
https://github.com/brandonwamboldt/varnish-dashboard
http://www.rubenortiz.es/2013/04/23/instalar-varnish-agent-dashboard/
How do you configure multiple varnish servers? How does your config.js file look like to add multiple varnish servers?
As far as I know, due the limitations of varnish is not possible to add multiples servers.
Take a look to this comment https://github.com/brandonwamboldt/varnish-dashboard/issues/5#issuecomment-139774251
And this is form the readme
“Servers is an array of objects to configure Varnish Agent backends. Eventually we’ll support multiple backend servers (see known issues).”
Nice article, I have followed this trying to setup the Varnish Agent and Dashboard. However, after completing all the steps all I get in my browser is a blank white screen with “stat() was not happy”. I’m racking my brain on this one. Any help is appreciated.
It’s seems like an issue in the installation. Take a look into the installation logs for more information what is wrong.
There is a similar issue reported, https://github.com/varnish/vagent2/issues/47, it looks like there is a version with a more detailed log output to identify what’s wrong, try with that.
change varnish-agent -H /var/www/varnish-dashboard/varnish-dashboard/ to varnish-agent -H /var/www/varnish-dashboard/