App Event Tracking & Key Performance Indicators
What KPIs are?
KPI stands for key performance indicator, a quantifiable measure of performance over time for a specific objective. KPIs provide targets for teams to shoot for, milestones to gauge progress, and insights that help people across the organization make better decisions. From finance and HR to marketing and sales, key performance indicators help every area of the business move forward at the strategic level.
Why Are KPIs Important?
KPIs are an important way to ensure your teams are supporting the overall goals of the organization. Here are some of the biggest reasons why you need key performance indicators.
- Keep your teams aligned: Whether measuring project success or employee performance, KPIs keep teams moving in the same direction.
- Provide a health check: Key performance indicators give you a realistic look at the health of your organization, from risk factors to financial indicators.
- Make adjustments: KPIs help you clearly see your successes and failures so you can do more of what’s working, and less of what’s not.
Hold your teams accountable: Make sure everyone provides value with key performance indicators that help employees track their progress and help managers move things along.
Types of KPIs
Financial Metrics and KPIs:
Typically focus on revenue and profit margins. Net profit, the most tried and true of profit-based measurements, represents the amount of revenue that remains, as profit for a given period, after accounting for all of the company’s expenses, taxes, and interest payments for the same period.
Customer Experience Metrics and KPIs:
Customer-focused KPIs generally center on per-customer efficiency, customer satisfaction, and customer retention. These metrics are used by customer service teams to better understand the service that customers have been receiving.
Process Performance Metrics and KPIs:
Process metrics aim to measure and monitor operational performance across the organization. These KPIs analyze how tasks are performed and whether there are process, quality, or performance issues. These types of metrics are most useful for companies with repetitive processes, such as manufacturing firms or companies in cyclical industries.
Marketing KPIs:
Marketing KPIs attempt to gain a better understanding of how effective marketing and promotional campaigns have been. These metrics often measure conversation rates on how often prospective customers perform certain actions in response to a given marketing medium.
IT KPIs:
A company may desire operational excellence; in this case, it may want to track how its internal technology (IT) department is operating. These KPIs may encourage a better understanding of employee satisfaction or whether the IT department is being adequately staffed.
Sales KPIs:
The ultimate goal of a company is to generate revenue through sales. Though revenue is often measured through financial KPIs, sales KPIs take a more granular approach by leveraging nonfinancial data to better understand the sales process.
Human Resource and Staffing KPIs:
Companies may also find it beneficial to analyze KPIs specific to their employees. Ranging from turnover to retention to satisfaction, a company may have a wealth of information already available about its staff.
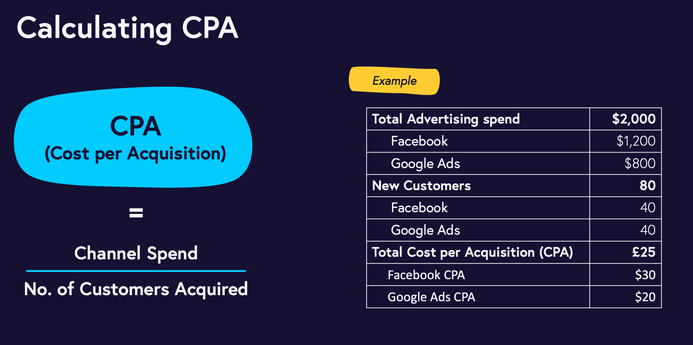
Example: Marketing – Cost Per Acquisition (CPA)
Concept:
The marketing metric Cost Per Acquisition is the total cost of acquiring a new customer via a specific channel or campaign. It’s often used in reference to media spend. In contrast to cost per conversion or cost per impression, CPA focuses on the cost for the complete journey from first contact to customer. Cost Per Acquisition is also differentiated from Customer Acquisition Cost (CAC) by its granular application – looking at specific channels or campaigns instead of an average cost for acquiring customers across all channels and headcount.
How to calculate:
- Campaign CPA Calculation:
($) Cost Per Acquisition = ($) total spent to acquire new customers via specific campaign / (#) new customers acquired via the same campaign
- Media Spend Calculation:
($) Cost Per Acquisition = ($) total media spend / (#) new customers acquired via media
To calculate the cost per acquisition, simply divide the total cost (whether media spend in total or specific channel/campaign to acquire customers) by the number of new customers acquired from the same channel/campaign.
Source Links
How to collect/track data from you application
Overview
Segment is a Customer Data Platform (CDP), which means that it provides a service that simplifies collecting and using data from the users of your digital properties (websites, apps, etc). You can collect, transform, send, and archive your first-party customer data.
Also use Unify, Segment’s identity resolution tool, to unify data from individual users to gain a wholistic understanding of their actions.
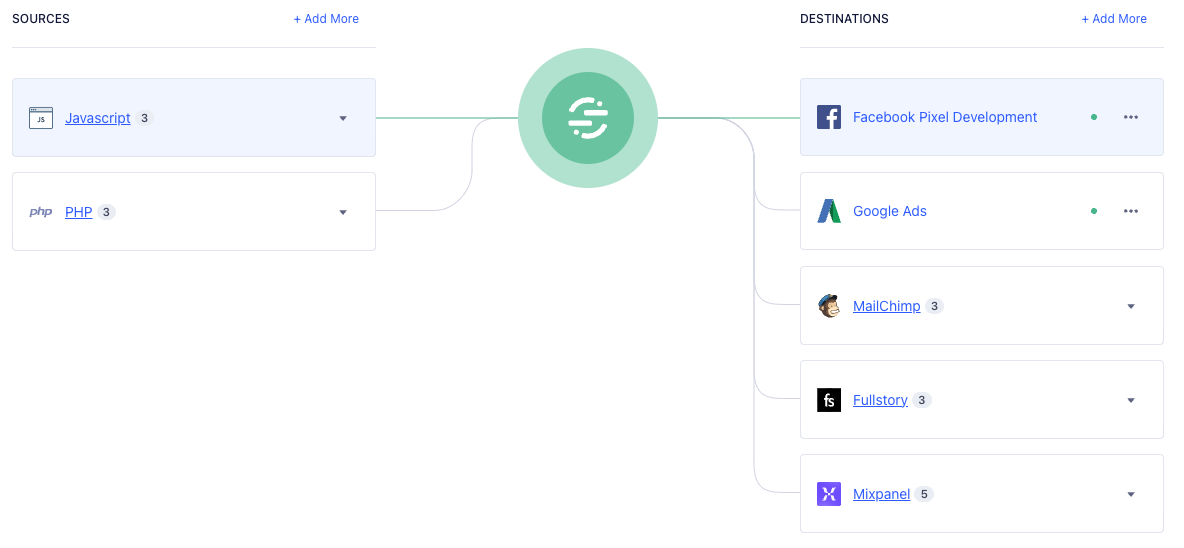
Sources:
Segment provides several types of Sources which you can use to collect your data, and which you can choose among based on the needs of your app or site. For websites, you can embed a library which loads on the page to create the Segment messages. If you have a mobile app, you can embed one of Segment’s Mobile libraries, and if you’d like to create messages directly on a server (if you have, for example a dedicated .NET server that processes payments), there are several server-based libraries that you can embed directly into your backend code. (You can also use cloud-sources to import data about your app or site from other tools like Zendesk or Salesforce, to enrich the data sent through Segment.)
Implementation: Javascript (Website) & Php (Server)
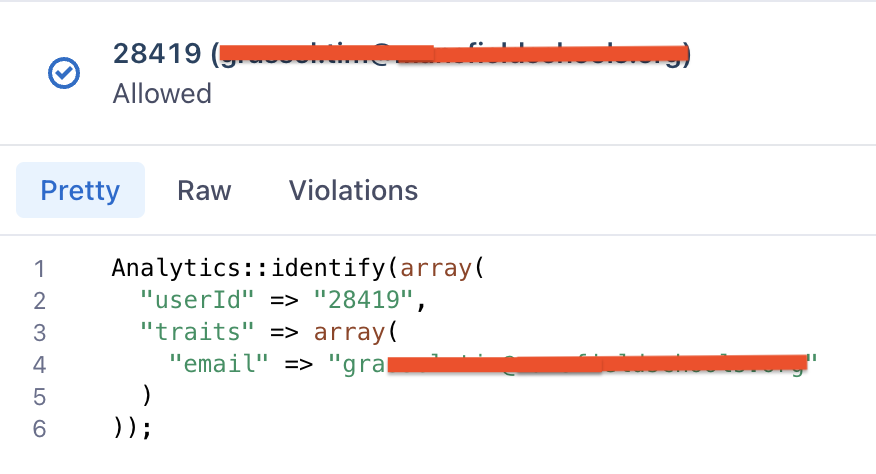
Identify:
Identify calls let you tie a user to their actions, and record traits about them. It includes a unique User ID and any optional traits you know about them.
Here’s what a basic call to identify might look like:
Segment::identify(array(
  "userId" => "2sfjej334",
  "traits" => array(
  "email" => $user->email,
  "name" => $user->name,
  "friends" => 25
  )
));
This will identify the user by his unique User ID (the one you know him by in your database) and label him with email, name and friends traits.
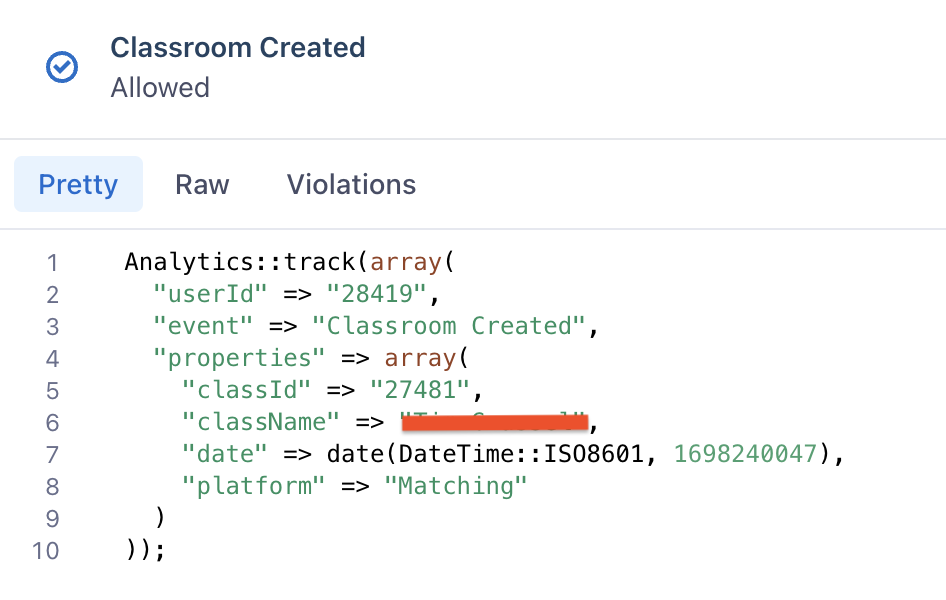
Track:
Track call lets you record the actions your users perform. Every action triggers what we call an “event”, which can also have associated properties. You’ll want to track events that are indicators of success for your site, like Signed Up, Item Purchased or Article Bookmarked.
Example track call:
Segment::track(array(
  "userId" => "f4ca124298",
  "event" => "Signed Up",
  "properties" => array(
    "plan" => "Enterprise"
  )
));
Note: these track calls are associated to specific “events” that at team/company level we need to have a data dictionary where all of these should be defined.
Destinations:
Once Segment generates the messages, it can send them directly to the Segment servers for translation and forwarding on to the Destinations you’re using, or it can make calls directly from the app or site to the APIs of your Destination tools. Which of these methods you choose depends on which Destinations you’re using and other factors. You can read more about these considerations in our Connection Modes documentation
Implementation: Mixpanel
Mixpanel enables you to build better products through powerful, self-serve product analytics to help you convert, engage, and retain more users.
Once the selected sources (Php & Javascript) from the app start triggering, the identify and track calls segment handles the integration with Mixpanel to generate a pass-through bridge so that Mixpanel can start holding all app “events” and map those in its database.
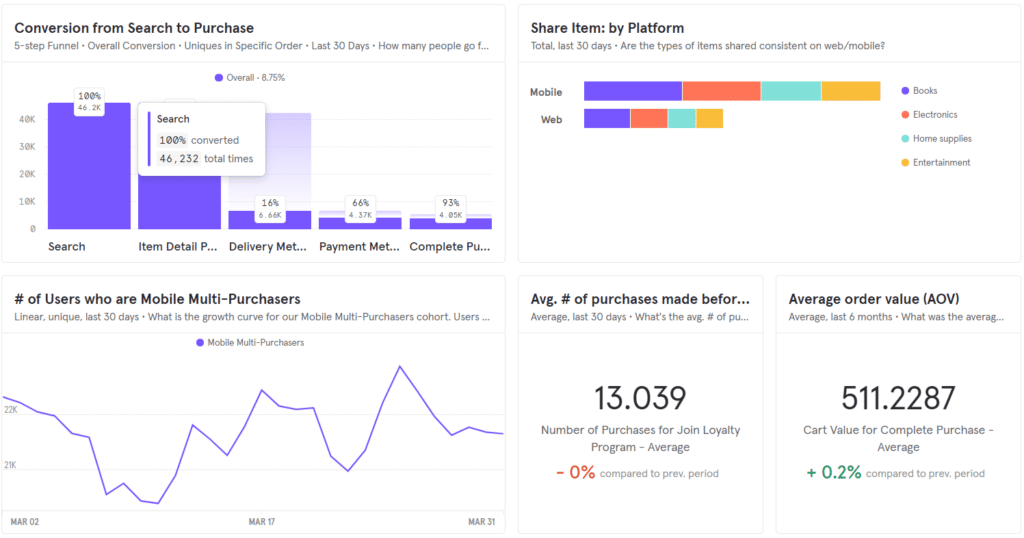
How to represent/graph KPIs metrics
Mixpanel
Overview
Mixpanel is an analytics tool that enables you to capture data on how users interact with your digital product. Mixpanel then lets you analyze this data with simple, interactive reports that let you query and visualize the data.
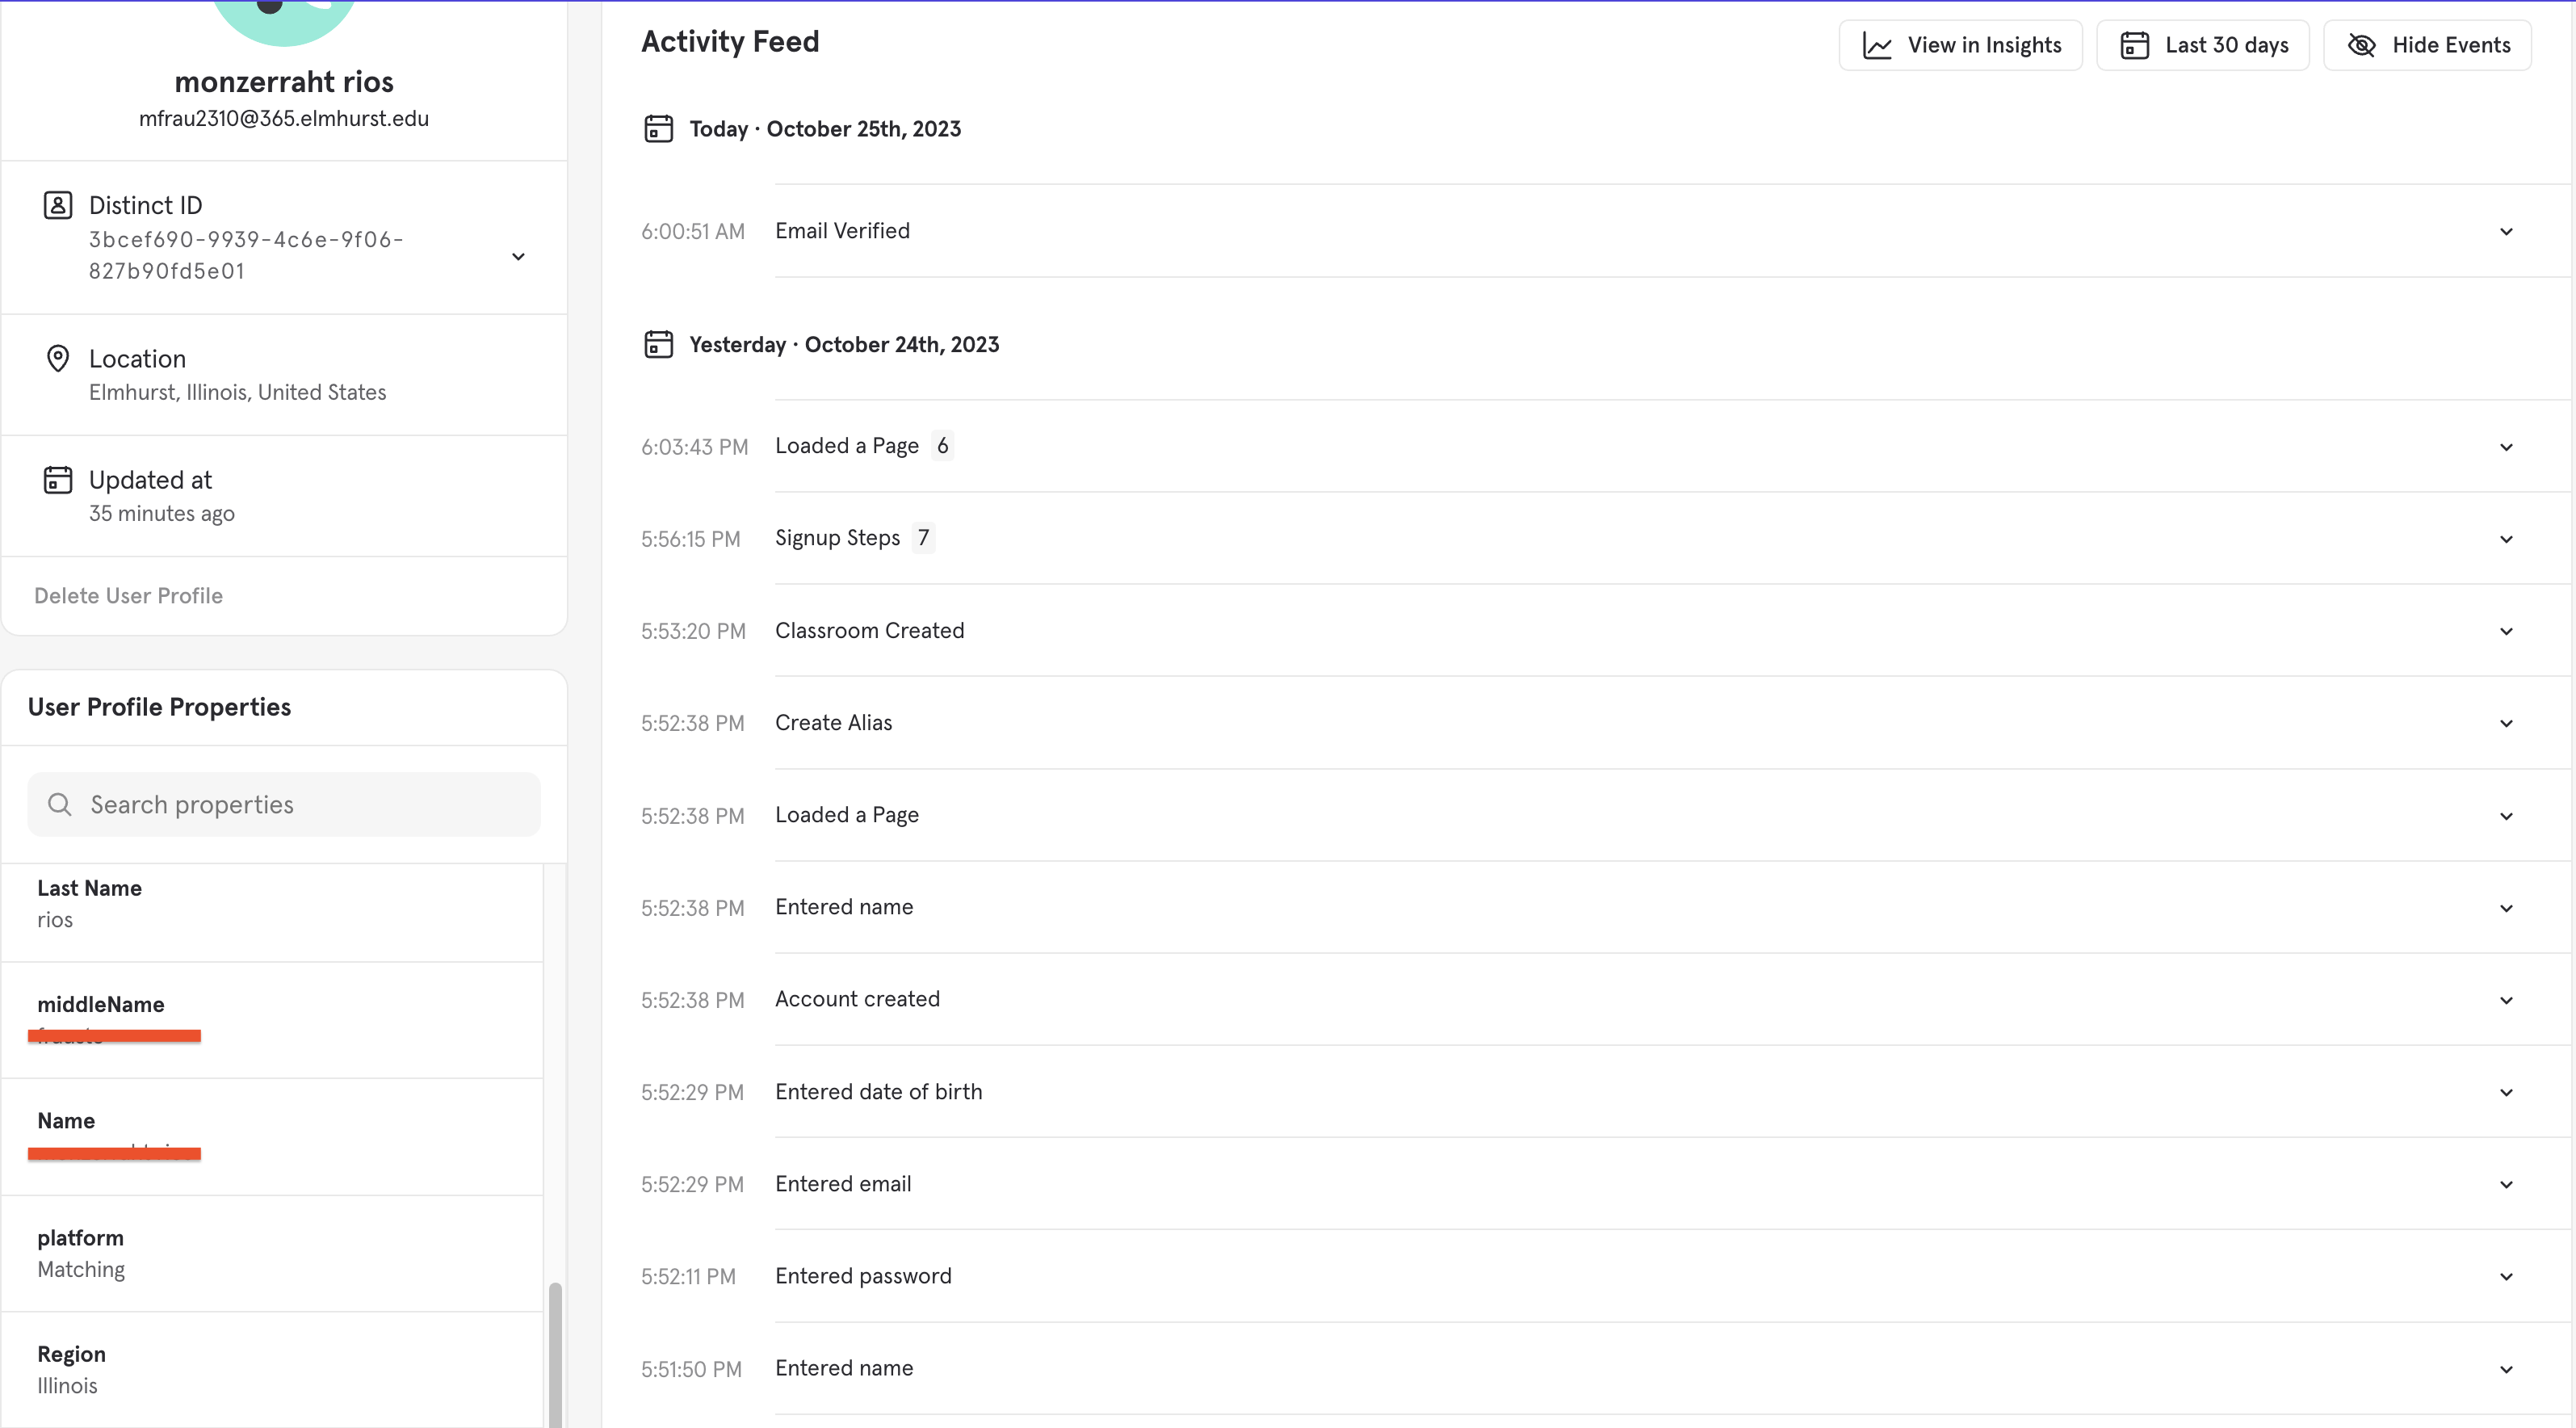
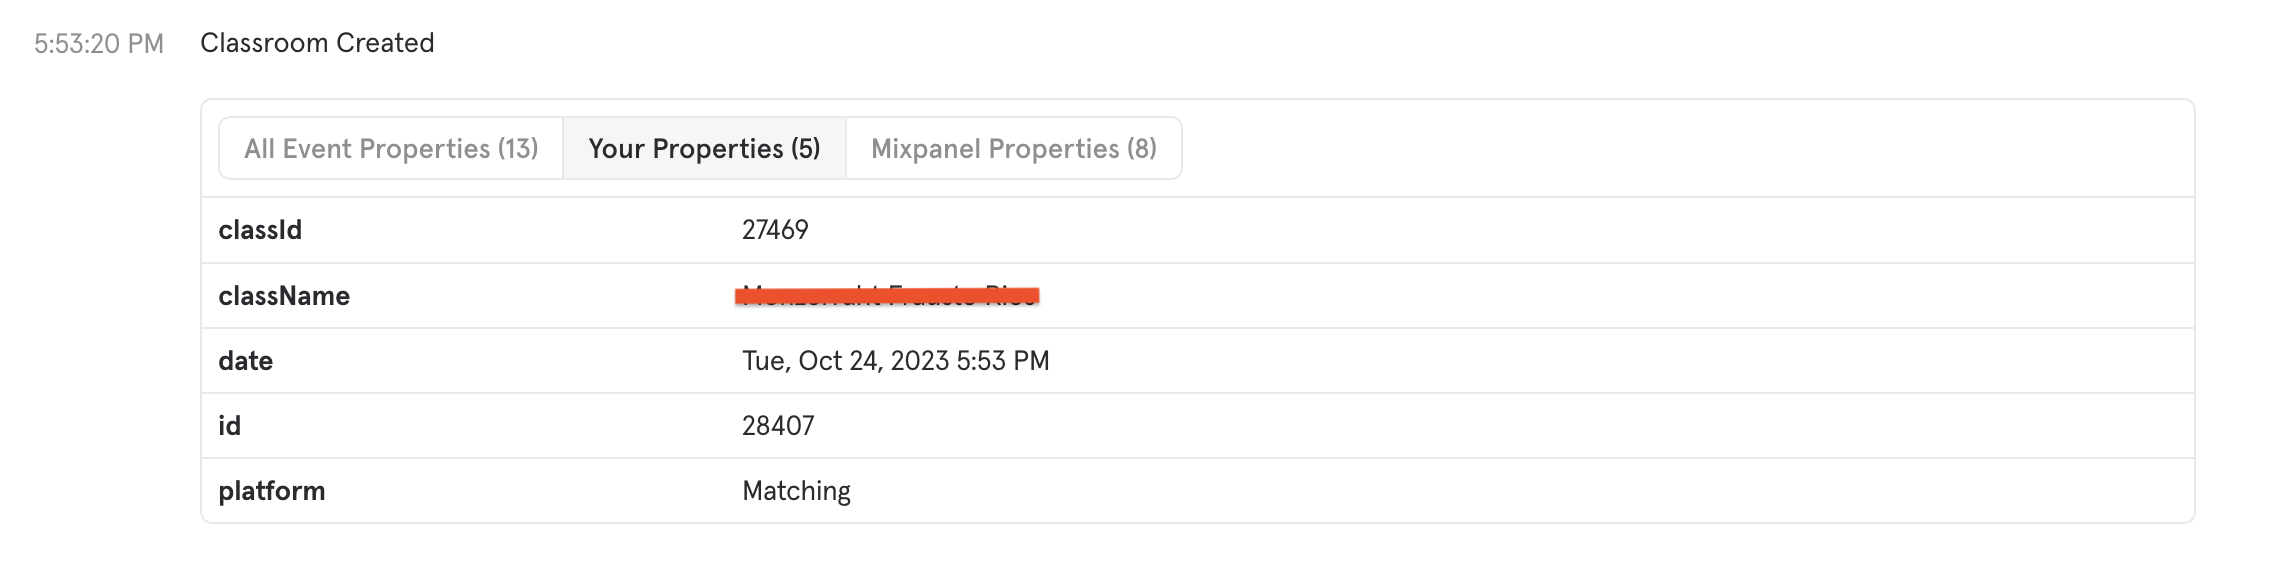
Events:
An event is a data point that represents an interaction between a user and your product. Events can be a wide range of interactions. For example, every time a customer purchases a coffee from your café app, there are details that describe the purchase the moment it happens. Actions like purchasing a coffee can be tracked as an event in Mixpanel.
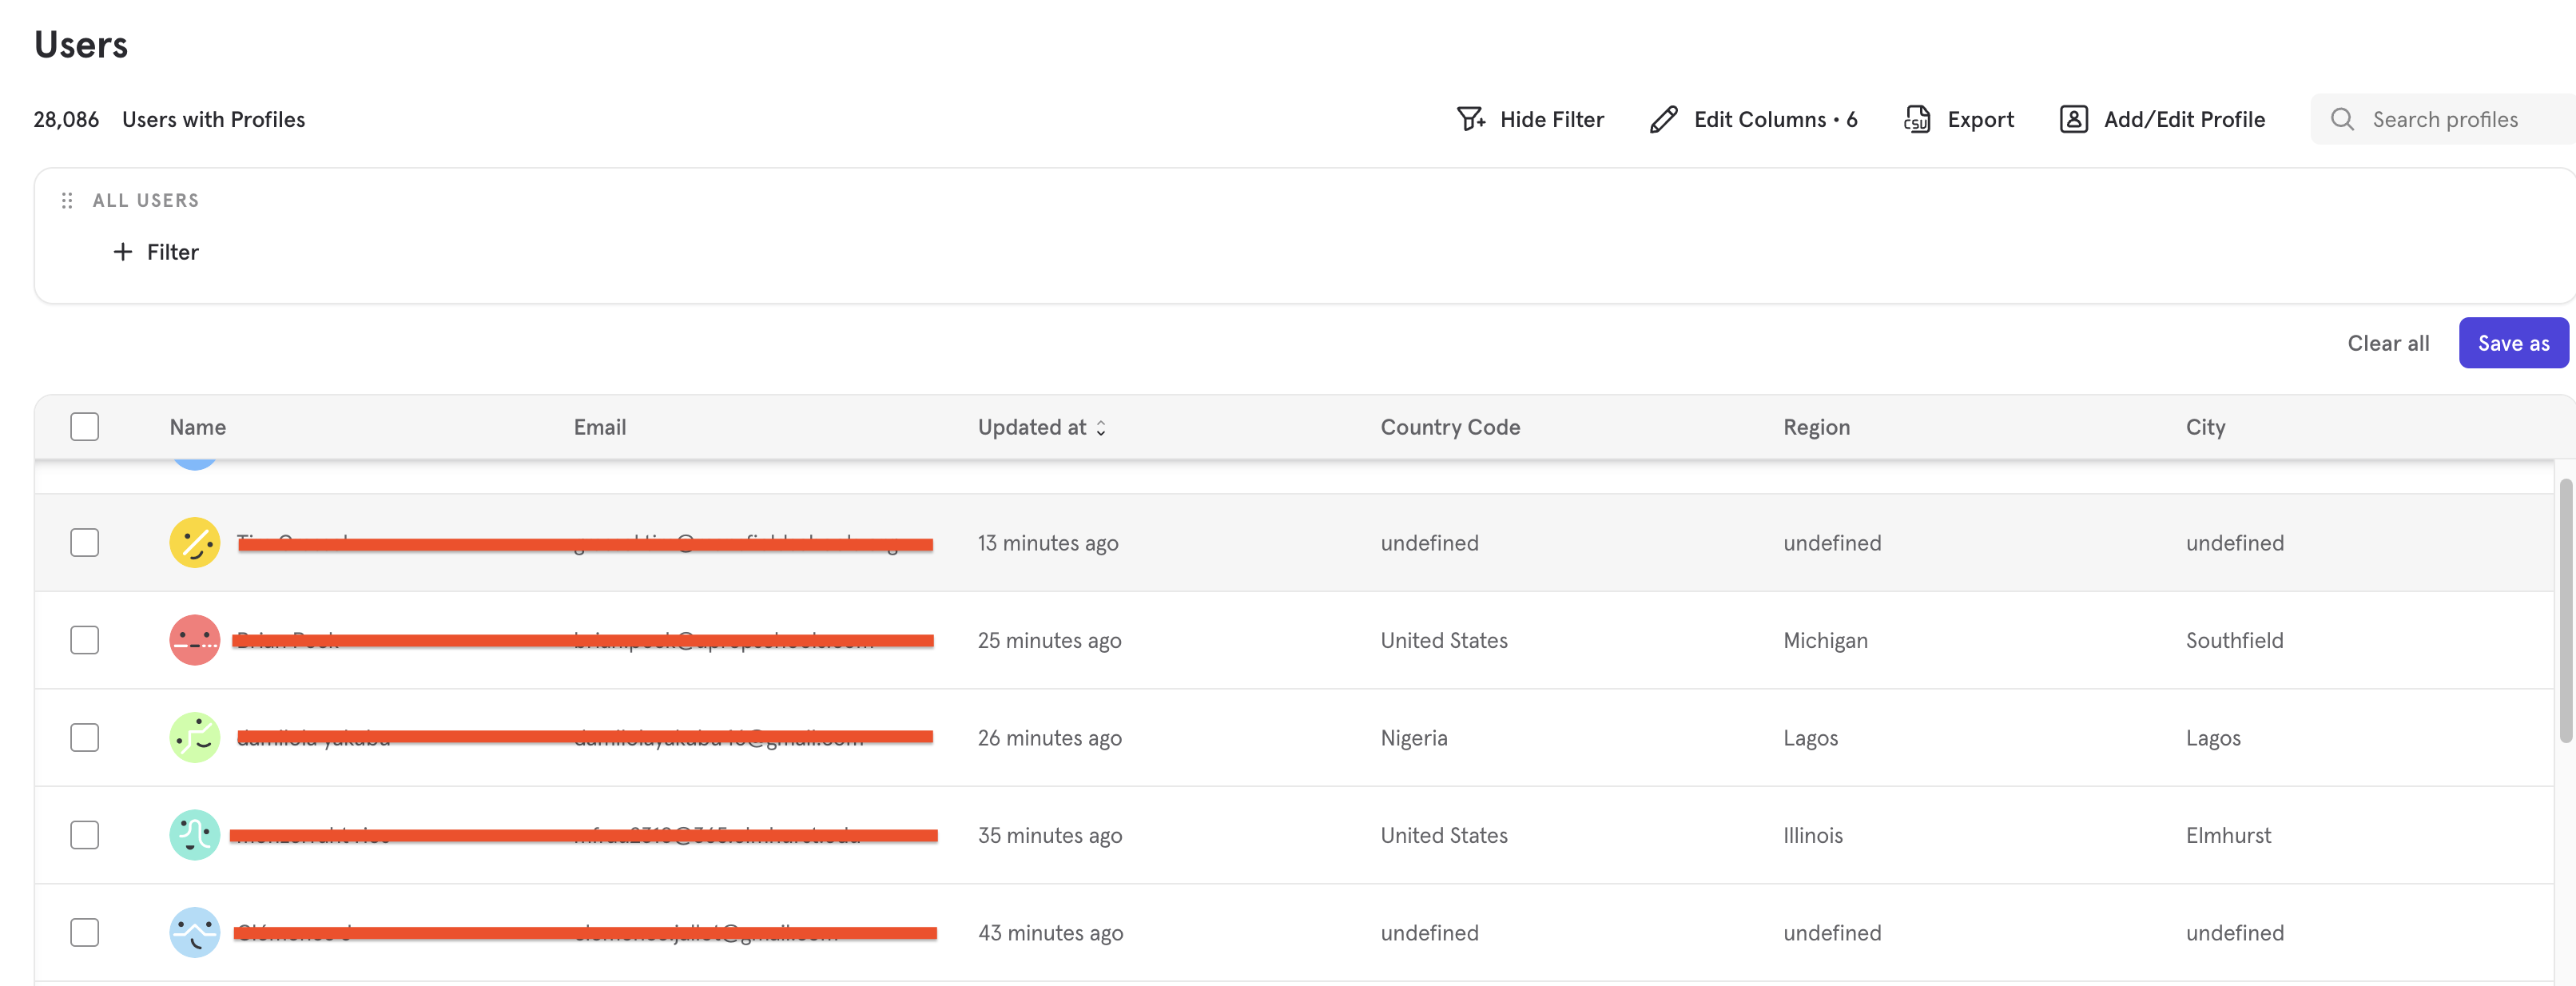
Users:
On the other side of an event is a user — the specific individual that completed an interaction with your product.
Because each user is unique, Mixpanel tracks which users completed what events and marries the two distinct data points by joining them.
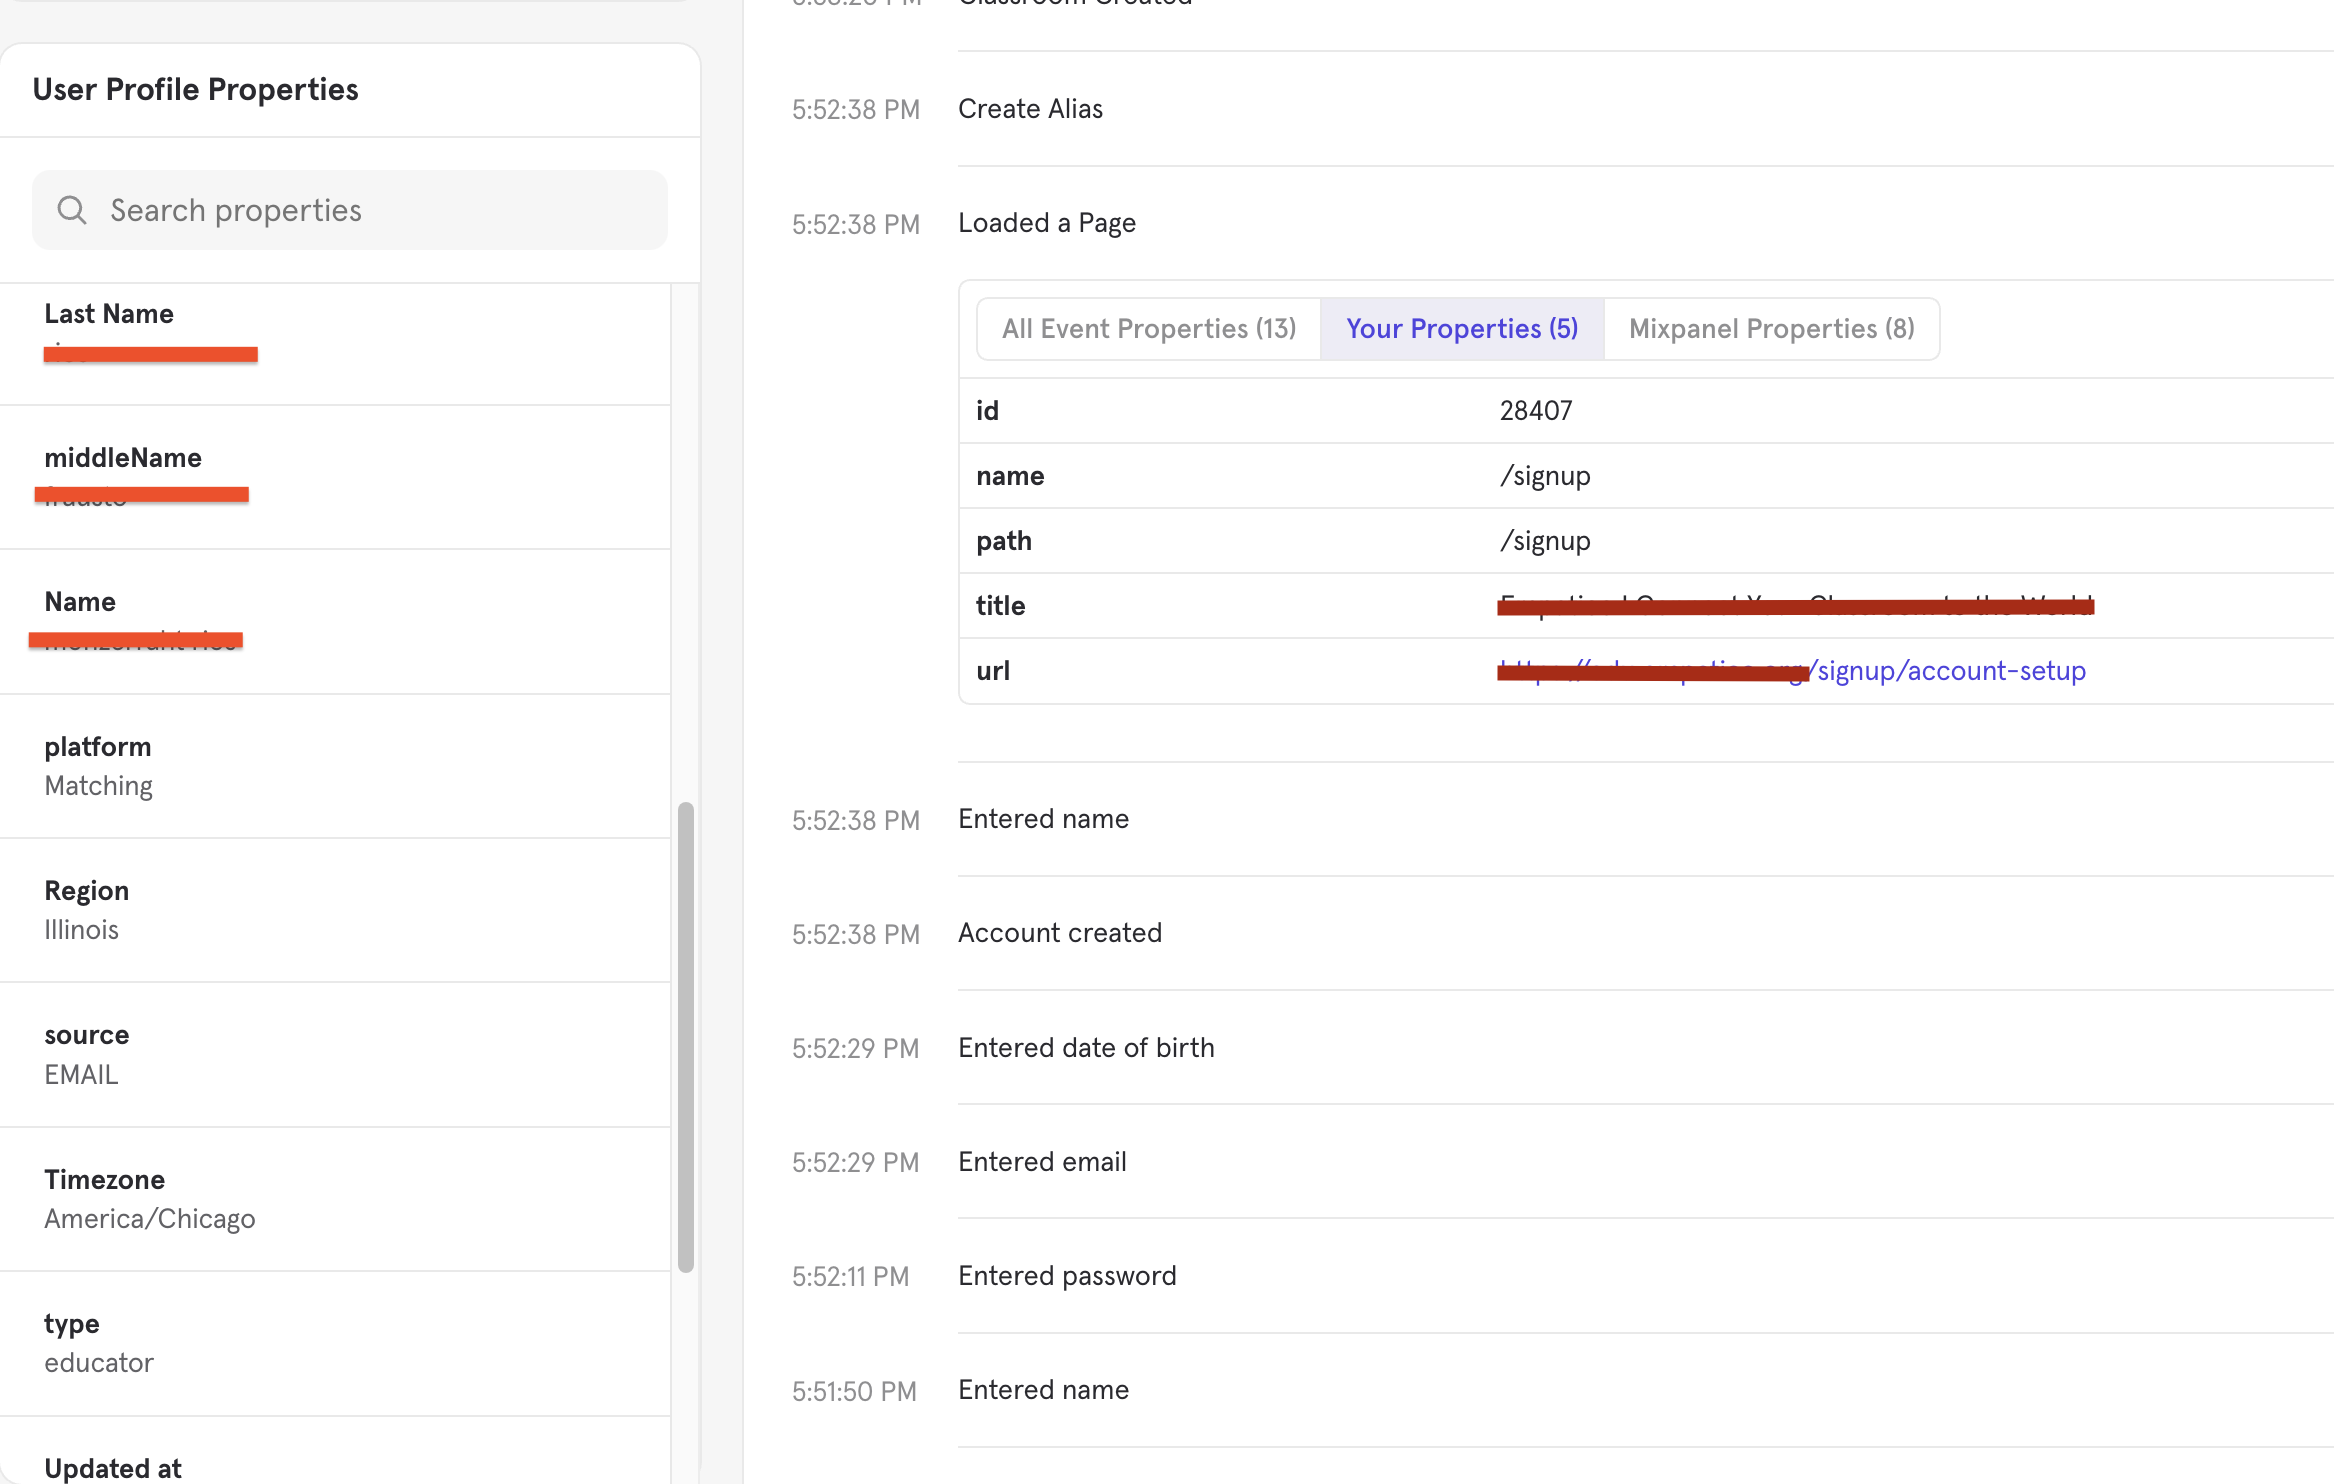
Properties
Properties are attributes that help you define the specifics of an Event or a User.
An Event Property describes an event. For a coffee purchase, the event would be Purchase and the event properties could be Item Type = Coffee and Item Price = $2.50.